
About the Choppiness Index Scalper Indicator
The Choppiness Index Scalper indicator for MT4 is designed to generate short-term trend signals.
It measures market “choppiness” using a scale from 0 to 100, focusing on the key levels of 38.2 and 61.8.
A yellow signal line moves slowly above and below these levels to indicate potential trade entries.
In an uptrend, the indicator generates buy signals when the line reaches the 38.2 level.
In a downtrend, it generates sell signals when the line reaches the 61.8 level.
To maximize performance, traders should use the indicator with a longer-term trend filter, such as a 200-period simple moving average.
This ensures trades align with the prevailing market direction and avoids counter-trend entries.
Free Download
Download the “choppiness-index.mq4” MT4 indicator
Key Features
- Short-term trend signal generator using the choppiness index.
- Signals based on the 38.2 and 61.8 levels for precise entries.
- The yellow signal line fluctuates slowly to filter noise and false signals.
- Works best in combination with a longer-term trend indicator like the 200-period MA.
Indicator Chart
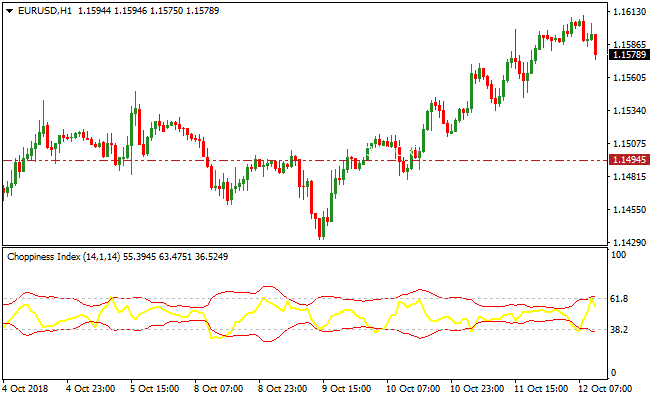
The Choppiness Index Scalper indicator is displayed below, showing short-term trend signals in real time.
The yellow signal line moves around the key levels of 38.2 and 61.8, providing clear buy and sell entry points in trending markets.
By combining the signal line with a 200-period moving average, traders can confirm the market direction and focus only on high-probability setups.
Guide to Trade with the Choppiness Index Scalper Indicator
Buy Rules
- Confirm the overall trend is upward using a 200-period simple moving average.
- Wait for the yellow signal line to reach the 38.2 level in an uptrend.
- Enter a buy trade at the close of the confirming candle.
- Avoid buying if the signal line is below 38.2 or the trend is weak.
Sell Rules
- Confirm the overall trend is downward using a 200-period simple moving average.
- Wait for the yellow signal line to reach the 61.8 level in a downtrend.
- Enter a sell trade at the close of the confirming candle.
- Avoid selling if the signal line is above 61.8 or the trend is weak.
Stop Loss
- For buy trades, place the stop loss slightly below the recent swing low or minor support level.
- For sell trades, place the stop loss slightly above the recent swing high or minor resistance level.
Take Profit
- Close buy trades if the yellow signal line rises above 61.8 or the trend reverses.
- Close sell trades if the yellow signal line falls below 38.2 or the trend reverses.
- Optionally, use nearby support or resistance levels for partial profit-taking.
- Exit if momentum slows significantly against your position.
Choppiness Index Scalper + Detrended Synthetic Price Histogram MT4 Scalping Strategy
This Forex strategy focuses on catching quick intraday moves by combining two indicators that respond fast to shifts in market conditions.
The Choppiness Index Scalper helps you identify moments when the market breaks out of a range, while the Detrended Synthetic Price Histogram confirms if price is moving with enough strength to justify entering a trade.
The method works well on lower time frames such as M1, M5 and M15.
The approach aims to avoid uncertain flat periods and focus only on moments when momentum starts to build.
You can find the used indicators here:
Choppiness Index Scalper MT4 Indicator
Detrended Synthetic Price Histogram MT4 Indicator
Buy Entry Rules
- The yellow line of the Choppiness Index Scalper touches or hits the 38.2 level.
- The trend must be upward. Confirm this by checking that the Detrended Synthetic Price Histogram shows green bars.
- Open a buy order when the candle closes with confirmation.
- Place the stop loss below the most recent swing low.
- Set take profit at 1.5 or 2 times the stop loss distance.
Sell Entry Rules
- The yellow line touches or hits the 61.8 level.
- Confirm a downtrend with red bars on the Detrended Synthetic Price Histogram.
- Open a sell order after a candle closes with confirmation.
- Place the stop loss above the nearest swing high.
- Set take profit at 1.5 or 2 times the stop loss.
Advantages
- Clear signal levels that are easy to follow.
- Histogram confirmation reduces false entries.
- Works well on volatile currency pairs.
- Suitable for traders who like short exposure to the market.
Drawbacks
- Signals may be less reliable in low volatility periods.
- Fast charts like M1 require quick execution.
- May generate multiple signals during choppy market conditions.
Case Study 1: GBPJPY M5 Scalping Example
During the London session, the yellow Choppiness Index line touched the 38.2 level.
At the same time the Detrended Synthetic Price Histogram switched to green bars.
A buy entry was taken at 191.40.
The stop loss was set below the previous swing at 191.10.
The market moved quickly in favor of the trade as volatility increased.
Price rallied to 191.95. This resulted in a gain of 55 pips.
Case Study 2: AUDUSD M15 Sell Example
In the early New York session, the yellow line hit the 61.8 level which signaled exhaustion of the up move.
At the same time, the histogram turned red.
A sell entry was opened at 0.6760.
The stop loss was placed above the latest high at 0.6780.
Momentum increased and price dropped to 0.6725.
The trade captured 35 pips with a clean directional move.
Strategy Tips
- The Choppiness Index Scalper provides its most reliable signals at the 38.2 and 61.8 levels.
- Always check the trend direction with the histogram before placing any order.
- Avoid trading during scheduled high impact news if you prefer stable moves.
- Focus on market sessions where volume is strongest. This improves the reaction time of both indicators.
- Do not take trades when the histogram changes color repeatedly within a short period.
Download Now
Download the “choppiness-index.mq4” Metatrader 4 indicator
FAQ
Which timeframes work best for the Choppiness Index Scalper?
Lower timeframes are ideal for scalping, while higher timeframes provide better context for intraday or swing trades.
Combine with a longer-term trend filter for optimal results.
How does the yellow signal line generate signals?
It fluctuates slowly around the key levels of 38.2 and 61.8.
Reaching 38.2 in an uptrend signals a buy, and reaching 61.8 in a downtrend signals a sell.
Can this indicator be used alone?
It works best when combined with a longer-term trend indicator, such as a 200-period moving average.
This prevents counter-trend trades and increases accuracy.
Summary
The Choppiness Index Scalper indicator highlights short-term trend entries using the 38.2 and 61.8 levels.
It helps traders identify buy and sell opportunities in alignment with the overall trend.
When combined with a longer-term trend filter, it provides a clear, systematic approach for scalping or intraday trades.
The indicator supports disciplined risk management and helps traders react efficiently to short-term price movements.


