
About the Dynamo Stochastic indicator
The Dynamo Stochastic indicator for MT4 is a momentum-based technical tool derived from the classic Slow Stochastic oscillator.
It operates within a fixed range between 0 and 100 to measure the relationship between a security’s closing price and its price range over a specific period.
When the oscillator line reaches the 100 level, the market is considered overbought, suggesting a potential downward reversal.
Conversely, when it hits the 0 level, the market is oversold, indicating a potential buying opportunity.
This tool helps traders identify exhausted price moves before they turn.
While the default settings are 5, 3, 3, they can be customized to suit different trading styles.
It works across all currency pairs and timeframes on the Metatrader 4 platform.
Free Download
Download the “dynamo-stochastic.mq4” MT4 indicator
Key Features
- Maps momentum using a 0 to 100 scale for clear overbought and oversold readings.
- Based on the reliable Slow Stochastic logic to reduce market noise.
- Provides adjustable inputs for K-period, D-period, and slowing to match market volatility.
- Functions as an excellent filter for identifying the end of corrective price pullbacks.
- Integrates easily with other technical indicators like EMA or Bollinger Bands.
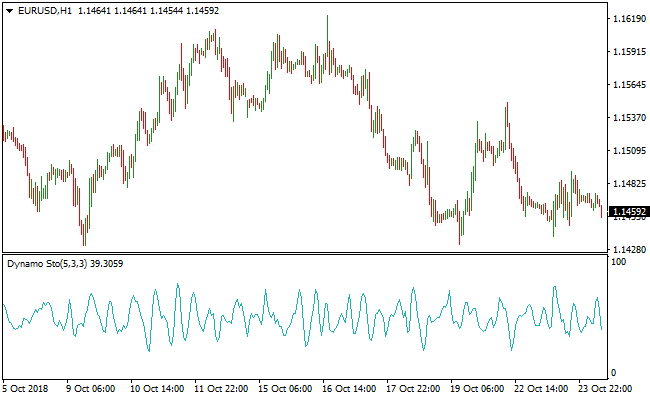
Indicator Chart
The Dynamo Stochastic indicator is displayed in a separate window below the main chart.
It features a fluctuating line that moves toward the upper and lower boundaries.
When the line touches the 0 level, it signals an extreme oversold condition.
When it reaches the 100 level, it signifies an extreme overbought condition.
These levels serve as alerts for potential trend continuations or reversals.
Guide to Trade with the Dynamo Stochastic Indicator
Buy Rules
- Confirm that the overall market trend is bullish using a trend-following indicator like an EMA.
- Wait for the Dynamo Stochastic indicator line to drop and reach the 0 oversold level.
- Look for price action to show signs of support while the oscillator is at the bottom.
- Enter a long position as the oscillator line begins to move upward from the 0 level.
Sell Rules
- Identify a bearish market environment using a primary trend indicator or price structure.
- Observe the Dynamo Stochastic indicator as it rises to reach the 100 overbought level.
- Wait for a bearish candle to form while the oscillator is at the upper extreme.
- Execute a short trade as the oscillator line starts to head back down toward the center.
Stop Loss
- Place the stop loss order a few pips below the recent swing low for buy entries.
- Set the stop loss order a few pips above the recent swing high for sell entries.
- Maintain a logical distance to allow for minor price fluctuations around the entry point.
Take Profit
- Target the opposite extreme of the oscillator for a safe exit point.
- Close the trade when the oscillator reaches the 100 level for buys or the 0 level for sells.
- Use a trailing stop once the trade moves into profit to capture extended trend moves.
Dynamo Stochastic Oscillator + Auto Trend Forecaster Forex Strategy
This MT4 strategy is designed to capture high-probability trades by combining trend direction with momentum reversals.
The Dynamo Stochastic Oscillator Indicator signals potential entries when it crosses back above 20 for a buy or below 80 for a sell.
The Auto Trend Forecaster Indicator confirms the market trend, showing a blue line for bullish conditions and an orange line for bearish conditions.
Using the oscillator to time pullbacks and the trend forecaster to confirm direction helps traders enter trades with more confidence.
This approach is suitable for M5, M15, and H1 time frames and works well for day traders looking for structured entries in trending markets.
Buy Entry Rules
- Auto Trend Forecaster shows a blue line indicating a bullish trend.
- Dynamo Stochastic Oscillator crosses back above 20 from below.
- Enter a buy trade at the open of the next candle after both conditions are met.
- Place a stop loss below the most recent swing low or recent support area.
- Close the trade when the oscillator crosses below 80, or the trend forecaster line turns orange.
Sell Entry Rules
- Auto Trend Forecaster shows an orange line indicating a bearish trend.
- Dynamo Stochastic Oscillator crosses back below 80 from above.
- Enter a sell trade at the open of the next candle after both conditions are met.
- Place a stop loss above the most recent swing high or recent resistance area.
- Close the trade when the oscillator crosses above 20, or the trend forecaster line turns blue.
Advantages
- Helps traders enter trades on pullbacks within the main trend for better timing.
- Visual signals are easy to interpret, reducing hesitation and confusion.
- Applicable across multiple time frames and currency pairs.
- Quick entry and exit signals make it suitable for scalping and intraday trading.
- Clear trend filtering helps avoid entering against strong market moves.
- Can improve risk management by aligning stop losses with swing highs and lows.
Drawbacks
- An oscillator can produce false signals in choppy or range-bound markets.
- Trades may be missed if both trend and oscillator conditions do not align perfectly.
- Not ideal for long-term trading or highly volatile pairs without proper adjustment.
- Success depends on proper discipline and adherence to the entry and exit rules.
Case Study 1
On EURUSD M15, the Auto Trend Forecaster displayed a blue line indicating a bullish trend.
The Dynamo Stochastic Oscillator crossed back above 20 at 1.1052.
A buy trade was opened on the next candle at 1.1054 with a stop loss at 1.1038 below the recent swing low.
Price moved up to 1.1090, hitting resistance and closing the trade with a profit of 36 pips.
Using the oscillator in conjunction with the trend line provided a reliable entry.
Case Study 2
On USDJPY M5, the Auto Trend Forecaster turned orange, indicating a bearish trend.
The Dynamo Stochastic Oscillator crossed back below 80 at 153.72.
A sell trade was entered on the next candle at 153.70 with a stop loss at 153.95 above the recent swing high.
Price dropped to 153.35 before hitting support, closing the trade with 35 pips profit.
The combination of trend confirmation and momentum reversal allowed for an effective scalp trade.
Strategy Tips
- Focus on currency pairs with clear trends to increase the probability of success.
- Wait for the oscillator to fully cross the threshold before entering to avoid false signals.
- Combine with candlestick patterns to improve the accuracy of entries.
- Adjust stop loss and take profit levels based on recent swing highs and lows.
- Trade during active sessions to capture stronger and more consistent moves.
- Skip trades when price action is choppy or momentum is weak.
- Maintain a trading journal to track which pairs and time frames provide the most reliable setups.
- Consider partial exits for longer moves if the trend is very strong.
Download Now
Download the “dynamo-stochastic.mq4” Metatrader 4 indicator
FAQ
Why should I use the Dynamo Stochastic indicator with a trend filter?
Oscillators like the Dynamo Stochastic indicator can stay at extreme levels of 0 or 100 for a long time during a strong trend.
If you sell purely because it is at 100 while the trend is strongly bullish, you may face losses.
Combining it with a tool like a moving average ensures you only take signals that align with the dominant market force.
Can I change the sensitivity of the oscillator?
Yes, you can modify the period settings in the MT4 inputs tab.
Lowering the numbers will make the indicator more sensitive to price changes, producing more signals.
Increasing the numbers will smooth out the movements, which is better for identifying major cycle turns on higher timeframes.
Is this indicator suitable for gold and oil trading?
The indicator performs well on commodities as long as you account for their high volatility.
Using it on the H1 or H4 timeframe for these assets is generally more reliable, as it helps filter out the aggressive price spikes often seen on lower timeframes.
Summary
The Dynamo Stochastic indicator is a powerful addition to any trader’s toolkit for timing market entries.
By focusing on extreme momentum levels, it provides a systematic way to identify when a price move has gone too far.
Its strength is maximized when used to trade pullbacks in the direction of a larger trend, allowing you to buy low and sell high with precision.
While it requires patience to wait for the 0 and 100 levels, the accuracy of these signals often leads to high-quality trade setups.


