
About the Kurtosis Oscillator Indicator
The Kurtosis Oscillator Indicator for MT4 is a sophisticated sentiment analysis tool designed to help traders measure the strength and direction of a price trend.
Unlike standard oscillators, this indicator is built using a complex calculation involving three core components: the Kurtosis, Fast Kurtosis, and Fast/Slow Kurtosis.
It functions by calculating the average difference of a fast moving average, smoothing it with an exponential moving average, and applying a final simple moving average to the result.
This layered approach allows the indicator to provide a smoothed representation of market momentum, appearing as a single red line that fluctuates around a central zero signal level.
For the best results, it is recommended to pair this tool with a trend-following filter to ensure signals align with the broader market bias.
Free Download
Download the “kurtosis-oscillator.ex4” MT4 indicator
Key Features
- Calculates market sentiment using a multi-step averaging process for enhanced data smoothing.
- Features a single red line interface that provides clear and objective trend signals.
- Utilizes a zero center line to distinguish between bullish and bearish market territories.
- Helps traders estimate the maturity of a trend based on the line’s distance from the zero level.
- Highly compatible with trend-following tools like the 100-period Exponential Moving Average.
- Works effectively across various currency pairs to identify momentum shifts in trending markets.
Indicator Chart
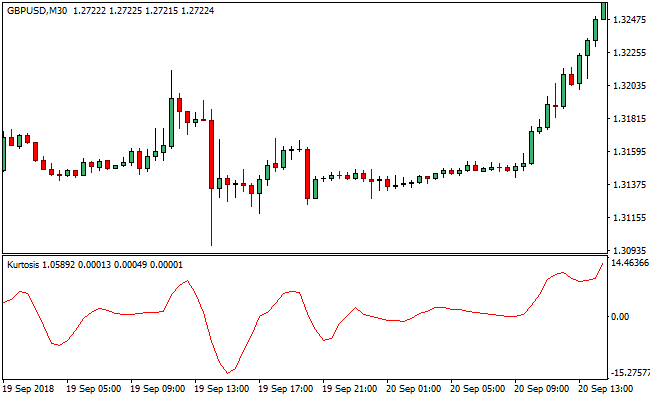
The chart illustrates the Kurtosis Oscillator Indicator positioned in the bottom window of the trading platform.
The red line provides the primary signal by oscillating above and below the zero level.
When the red line rises above zero, it indicates a bullish sentiment, while a move below the zero level highlights a bearish environment, helping traders time their entries during active market phases.
Guide to Trade with Kurtosis Oscillator Indicator
Buy Rules
- Check the overall market trend using a higher timeframe or a long-term moving average.
- Wait for the red line of the Kurtosis Oscillator Indicator to rise above the zero signal level.
- Ensure the line stays firmly above the zero level after the current candle closes.
- Execute the long position when the bullish sentiment is confirmed by the positive alignment.
Sell Rules
- Check the overall market trend to ensure you are not trading against the dominant bias.
- Monitor the red line of the Kurtosis Oscillator Indicator as it plunges below the zero signal level.
- Confirm the red line remains in the negative territory upon the completion of the candle.
- Execute the short position when the indicator validates the presence of bearish momentum.
Stop Loss
- Place the protective stop loss a few pips below the most recent swing low for buy orders.
- Position the stop loss order just above the most recent swing high when initiating a sell.
- Consider a volatility-based stop if the red line shows a sharp slope during the entry.
- Move the stop loss to break even once the trade has achieved a 1:1 risk-to-reward ratio.
Take Profit
- Close all buy orders if the red line of the Kurtosis Oscillator Indicator falls back below zero.
- Close all sell orders if the red line of the Kurtosis Oscillator Indicator surges back above zero.
- Alternatively, exit at a major support or resistance level identified on your main price chart.
Kurtosis Oscillator + Super Half Trend MT4 Forex Strategy
This Forex strategy uses the Kurtosis Oscillator together with the Super Half Trend Indicator MT4.
The Kurtosis Oscillator signals a buy when it crosses above zero and a sell when it crosses below zero.
The Super Half Trend confirms the trend direction with blue arrows for bullish trends and red arrows for bearish trends.
Entering trades only when both indicators align increases the probability of a successful move.
This strategy is designed for day trading on M15, M30, and H1 charts.
It works best on liquid currency pairs such as EURCHF, AUDNZD, GBPJPY, and USDCHF, where the trend and momentum are easier to follow, and spreads are low.
Buy Entry Rules
- The Super Half Trend shows a blue arrow, confirming an upward trend.
- The Kurtosis Oscillator crosses above zero, confirming buying momentum.
- Open a long position when both indicators match.
- Place the stop loss a few pips below the most recent swing low.
- Close the trade when the oscillator starts falling back toward zero or when the Super Half Trend arrow changes to red.
Sell Entry Rules
- The Super Half Trend shows a red arrow, confirming a downward trend.
- The Kurtosis Oscillator crosses below zero, confirming selling momentum.
- Open a short position when both indicators match.
- Place the stop loss a few pips above the most recent swing high.
- Close the trade when the oscillator starts rising toward zero or when the Super Half Trend arrow changes to blue.
Advantages
- Combining trend direction and momentum improves accuracy compared to using a single indicator.
- Works well on multiple time frames, giving flexibility for day trading or swing trading.
- Helps traders avoid entering against the main market direction.
- It can be applied to a wide range of currency pairs with good liquidity.
- Quick confirmation from oscillator crossings allows traders to react faster to trend changes.
- Reduces the number of false trades during minor pullbacks within a trend.
Drawbacks
- Requires attention to monitor oscillator crossings and arrow confirmations.
- Stop loss may need to be wider on volatile pairs, which increases exposure.
- Quick reversals can temporarily produce false signals before the trend continues.
Case Study 1: EURCHF H1
During the European session, the Super Half Trend showed a blue arrow indicating a bullish trend.
Shortly after, the Kurtosis Oscillator crossed above zero.
A long trade was opened with a stop loss placed 18 pips below the recent swing low.
Price continued upward, and the trade was closed after 40 pips when the oscillator flattened and momentum slowed.
Case Study 2: AUDNZD M30
During the Asian session, the Super Half Trend turned red, showing a bearish trend.
The Kurtosis Oscillator crossed below zero, confirming downward momentum.
A short trade was opened with a stop loss 12 pips above the swing high.
AUDNZD dropped steadily, and the trade was closed after 30 pips when the oscillator began rising.
The trade captured a strong intraday move using trend and momentum alignment.
Strategy Tips
- Always wait for both the oscillator and trend arrow to confirm direction before entering a trade.
- Monitor higher time frames to ensure your trade aligns with the overall market trend.
- Adjust stop loss based on current volatility to avoid being stopped out prematurely.
- Close trades when momentum begins to fade instead of waiting for a fixed pip target.
- Focus on pairs with strong trending moves for higher probability setups.
- Be patient and skip trades when signals are conflicting or the market is choppy.
- Use smaller position sizes when market volatility is high to protect your capital.
- Regularly review past trades to learn which patterns and times of day are most profitable.
Download Now
Download the “kurtosis-oscillator.ex4” Metatrader 4 indicator
FAQ
What is the benefit of the zero signal level?
The zero level serves as the equilibrium point.
When the indicator stays above it, buyers are in control; when it stays below, sellers dominate the market sentiment.
Why should I use a 100 EMA with this indicator?
The 100 EMA helps you identify the long-term trend.
This prevents you from taking counter-trend signals, which are often less reliable than those moving in the direction of the EMA.
Can I adjust the default periods of the Kurtosis?
Yes, the default periods of 3 and 66 can be modified in the inputs.
Adjusting these values allows you to make the red line more or less sensitive to price changes.
Summary
The Kurtosis Oscillator Indicator is a specialized tool that excels at identifying the true position of market sentiment.
Its unique construction provides a smoother perspective on price trends than many standard oscillators.
While it is simple to use, its reliability is significantly improved when traded in alignment with a primary trend filter.
This indicator is a valuable addition for traders seeking a mechanical and objective way to time their market entries.


