
About the Turbo JRSX Indicator
The Turbo JRSX Indicator is a retracement-focused oscillator designed to help traders identify low-risk entry points within established trends.
It blends the logic of Turbo JRSX, Step Moving Average, and an RSI-based filter to track momentum exhaustion and renewed price interest.
Rather than chasing breakouts, the indicator highlights moments where price temporarily pulls back before resuming its primary direction.
The oscillator operates between defined upper and lower zones, allowing traders to anticipate overbought and oversold conditions with confidence.
Its color-changing line provides immediate feedback on market pressure, making it easier to time entries without cluttering the chart.
Turbo JRSX works across all currency pairs and timeframes, which makes it adaptable for scalping, intraday trading, and swing setups.
Free Download
Download the “turbo-jrsx-indicator.ex4” MT4 indicator
Key Features
- Combines Turbo JRSX, Step-MA, and RSI filtering.
- Identifies retracement entries within trending markets.
- Uses dynamic color changes to signal momentum shifts.
- Operates between 30 and 70 reference levels.
- Suitable for multiple trading styles and timeframes.
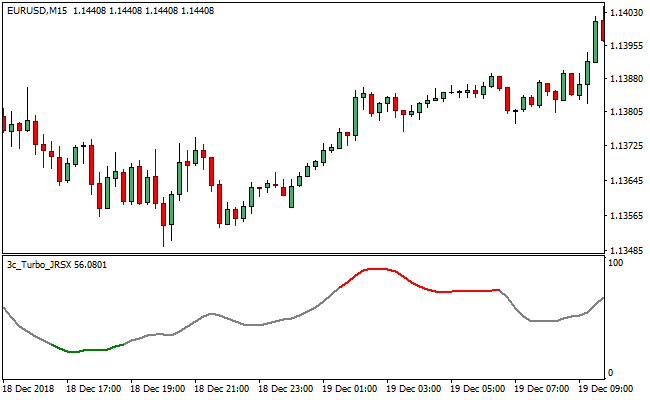
Indicator Chart
The chart displays the Turbo JRSX Indicator in a separate window beneath the price action.
Color transitions within the oscillator highlight overbought and oversold conditions.
Buy and sell opportunities emerge as the line exits extreme zones in the direction of the broader trend.
Guide to Trade with the Turbo JRSX Indicator
Buy Rules
- Confirm the overall market trend is bullish.
- Wait for the Turbo JRSX line to move below the 30 level.
- Enter a buy when the line breaks back above 30.
- Ensure the line color reflects renewed bullish momentum.
Sell Rules
- Confirm the overall market trend is bearish.
- Wait for the Turbo JRSX line to rise above the 70 level.
- Enter a sell when the line drops back below 70.
- Confirm momentum turns bearish through the color shift.
Stop Loss Rules
- Place the stop loss beyond the most recent swing high or low.
- Use a volatility-based stop derived from the recent price range.
- Exit the trade if momentum fails to follow through after entry.
Take Profit Rules
- Target the next visible support or resistance level.
- Secure partial profits once price reaches the prior structure zones.
- Close the trade when the oscillator re-enters an extreme zone.
Turbo JRSX Indicator + Super Trend NRP Forex Scalping Strategy
This strategy combines the Turbo JRSX MT4 Indicator with the SuperTrend NRP MT4 Indicator.
The Turbo JRSX shows a red line for bullish entries and a green line for bearish entries.
The SuperTrend NRP plots a trend line: green when the trend is up, and orange when the trend is down.
By using the trend filter from SuperTrend together with the JRSX signal line, this strategy aims to scalp intraday moves with clear confirmation.
This setup works well on intraday timeframes like M1 and M5, especially during active market hours.
It helps trade in the direction of the trend while capturing momentum shifts and reversals with tight entry rules.
Buy Entry Rules
- The SuperTrend NRP line must be green, indicating an uptrend.
- The Turbo JRSX line must turn red, signaling a buy entry.
- Enter a long trade as soon as the red Turbo JRSX line confirms and the SuperTrend is still green.
- Set a stop loss just below the recent swing low on the chosen timeframe.
- Exit when the Turbo JRSX line turns green (signal reversal), or when the SuperTrend line switches from green to orange (trend change).
Sell Entry Rules
- The SuperTrend NRP line must be orange, indicating a down‑trend.
- The Turbo JRSX line must turn green, signaling a sell entry.
- Enter a short trade when the green JRSX line confirms and SuperTrend remains orange.
- Place the stop loss just above the recent swing high.
- Take profit or exit when the JRSX line turns red, or when the SuperTrend switches from orange to green.
Advantages
- Trend alignment from SuperTrend helps avoid counter‑trend trades.
- Turbo JRSX gives clear, momentum‑based entries.
- Scalping on M1 and M5 allows many trade opportunities per session.
- Stop loss and exit are well-defined, making risk management straightforward.
- The combination filters out noise and weak signals by requiring both trend and signal to agree.
Drawbacks
- In very choppy or ranging markets, SuperTrend may flip often, causing false trades.
- The JRSX signal line may lag slightly during fast price spikes, leading to delayed entries or exits.
- Exiting only when the signal line reverses or trend changes may give back a portion of the gains.
- This strategy requires constant attention, especially on M1, where trades develop quickly.
Example Case Study 1
On EUR/USD M5 during the London session, the SuperTrend NRP line was green, signaling a bull trend.
The Turbo JRSX line then turned red.
A long position was opened at candle close, with a stop loss 7 pips below the recent swing low.
After several candles, the JRSX line turned green again, reversing the signal, and the trade was closed for a profit of about 12 pips.
Example Case Study 2
On GBP/CHF M1 during New York hours, the SuperTrend line turned orange, indicating a downtrend.
The Turbo JRSX line flipped to green, giving a sell signal.
A short position was taken at candle close, with a stop loss 8 pips above the swing high.
The price dropped steadily, and the trade was exited when the SuperTrend turned green, capturing around 15 pips.
Strategy Tips
- Focus on times when the market is most volatile, such as London or New York, to get stronger price action and better signal clarity.
- If SuperTrend is flat or hesitating, skip trades because the trend strength is not clear enough.
- Use small position sizes since scalping involves tight stop losses and quick trades.
- Wait for the JRSX line to clearly change color only after SuperTrend confirms the trend.
Download Now
Download the “turbo-jrsx-indicator.ex4” Metatrader 4 indicator
FAQ
What type of market works best with Turbo JRSX?
The indicator performs best in trending markets where price frequently retraces before continuing in the same direction.
Do the 30 and 70 levels need to be manually added?
Yes, traders can draw horizontal reference lines at these levels using standard platform tools for easier visualization.
Can Turbo JRSX be used without other indicators?
It can function on its own, but results often improve when trend direction is confirmed using a moving average or market structure.
Is the indicator better for fast or slow timeframes?
Turbo JRSX adapts well to both, though lower timeframes will produce more frequent signals that require stricter risk control.
Summary
The Turbo JRSX Indicator offers traders a disciplined way to participate in trends without chasing extended price moves.
By focusing on retracements from overbought and oversold zones, it supports more measured entries with defined risk.
Its visual feedback makes momentum shifts easy to recognize, even during fast market conditions.
With proper trend alignment and sensible trade management, Turbo JRSX can become a dependable tool for consistent decision-making.


