
About the Visual MACD Indicator
The Visual MACD indicator is a trend-following tool designed to support swing traders who prefer clean and intuitive market signals.
This indicator transforms MACD data into wave-like bodies that move along the price chart.
These waves expand and contract based on momentum, making it easier to judge trend strength without digging into raw values.
The indicator works best when trades are taken in the direction of the dominant market trend.
Larger waves signal stronger momentum, while smaller waves suggest weakening pressure or consolidation.
Two moving average lines run alongside the waves, and their interaction provides reliable entry and exit timing.
Because the Visual MACD focuses on short-term trend behavior, it is especially useful for swing trading on intraday and higher timeframes.
It helps traders stay aligned with momentum while avoiding unnecessary countertrend trades.
Free Download
Download the “visual-macd.ex4” MT4 indicator
Key Features
- Wave-based MACD display that reflects momentum strength.
- Attached moving averages for crossover confirmation.
- Dark slate blue and maroon clouds for directional bias.
- Works well for swing and short-term trend trading.
- Helps filter weak signals during low momentum phases.
Indicator Chart
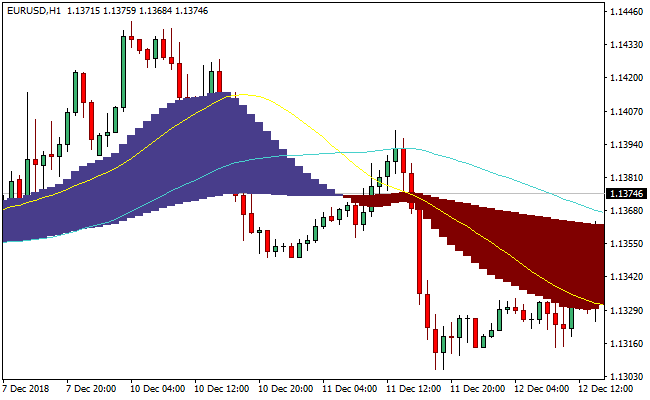
The Visual MACD indicator chart shows colored cloud waves forming above or below the price, along with two smooth average lines.
Blue clouds indicate bullish momentum, while maroon clouds point to bearish pressure.
Crossovers between the average lines often mark shifts in trend direction.
Guide to Trade with the Visual MACD Indicator
Buy Rules
- Wait for a dark slate blue cloud to form below the candlesticks.
- Ensure price is trading in line with the broader bullish trend.
- Confirm momentum by observing expanding wave size.
- Enter after a clear crossover in favor of buyers.
Sell Rules
- Look for a maroon cloud forming above the price bars.
- Confirm that the higher timeframe trend is bearish.
- Check that wave size is increasing to the downside.
- Enter after a bearish crossover is completed.
Stop Loss
- Place the stop loss beyond the most recent swing high or low.
- Use a fixed ATR-based distance to account for volatility.
- Exit if the Visual MACD wave shrinks rapidly after entry.
Take Profit
- Target the next major support or resistance zone.
- Scale out profits as the wave size begins to contract.
- Close the trade when the MACD average lines cross back.
Visual MACD Indicator and Zee Zee Alert Forex Scalping Strategy
This strategy combines the Visual MACD MT4 Indicator and the Zee Zee Alert MT4 Indicator.
The Visual MACD shows a cloud where dark slate blue signals a buy trend and maroon signals a sell trend.
The Zee Zee Alert shows lines: red for buy signals and blue for sell signals.
Combining trend direction with precise entry alerts makes this strategy suitable for scalping short-term moves.
It works best on M1 and M5 charts and is designed for traders looking to capture fast trend-aligned trades with clear entry and exit rules.
Buy Entry Rules
- The Visual MACD cloud must be dark slate blue, indicating a bullish trend.
- The Zee Zee Alert shows a red line, signaling a buy.
- Enter a long position at the close of the candle with the red line while the cloud remains bullish.
- Place a stop loss a few pips below the most recent swing low on the same timeframe.
- Exit when the Zee Zee Alert red line disappears or the cloud turns maroon.
Sell Entry Rules
- The Visual MACD cloud must be maroon, indicating a bearish trend.
- The Zee Zee Alert shows a blue line, signaling a sell.
- Enter a short position at the close of the candle with the blue line while the cloud remains bearish.
- Set a stop loss a few pips above the most recent swing high.
- Exit when the Zee Zee Alert blue line disappears or the cloud turns dark slate blue.
Advantages
- The Visual MACD cloud clearly shows trend direction.
- The Zee Zee Alert provides timely entry signals.
- Suitable for scalping with multiple opportunities on M1 and M5.
- Stop loss and exit rules are simple and well-defined.
- Helps avoid trading against the trend and reduces noise.
Drawbacks
- Cloud color can change quickly in choppy markets, causing false signals.
- Alert lines alone may produce whipsaw trades without trend confirmation.
- Exit signals may occur late in fast reversals.
Example Case Study 1
On EUR/GBP M1 during the London session, the Visual MACD cloud turned dark slate blue.
A red Zee Zee Alert line appeared, signaling a buy.
A long trade was entered at candle close, stop loss 5 pips below the swing low.
Price moved upward, and the red line disappeared after a few bars, resulting in an 8-pip profit.
Example Case Study 2
On AUD/USD M5 during New York hours, the cloud turned maroon, signaling a downtrend.
A blue Zee Zee Alert line appeared, signaling a sell.
A short trade was entered at candle close with a stop loss 7 pips above the recent high.
Price dropped, and the cloud later flipped to dark slate blue, closing the trade for a 15-pip profit.
Strategy Tips
- Trade during active sessions like London and New York for clearer cloud signals and alert lines.
- Avoid trades when the cloud is flat or slowly changing, which indicates a weak trend.
- Use small positions because tight stops and rapid scalps increase risk.
- Wait for the alert line only after the cloud is fully formed for stronger confirmation.
- Keep a trading journal to track which currency pairs work best on M1 and M5.
Download Now
Download the “visual-macd.ex4” Metatrader 4 indicator
FAQ
Which timeframe works best with the Visual MACD?
The indicator performs best on M15 and higher timeframes. Swing traders often prefer H1 and H4 to reduce noise.
Can the Visual MACD be used for scalping?
It can be used on lower timeframes, but signals may become less reliable due to rapid momentum shifts.
What does wave size represent?
Wave size reflects momentum strength. Larger waves indicate stronger trend pressure, while shrinking waves suggest weakening moves.
Summary
The Visual MACD indicator offers a practical way to read momentum and trend strength without relying on traditional histograms.
Its wave-style presentation helps traders quickly assess whether a trend is gaining or losing power.
By focusing on trend-aligned entries and disciplined exits, the indicator fits well into structured swing trading approaches.
With proper tuning and patience, it can become a dependable part of a trader’s technical toolkit.


