About the Volatility Hyper Trend Indicator
The Volatility Hyper Trend indicator is a technical trading tool designed to measure market volatility while clearly defining trend direction.
It combines volatility-based calculations with trend logic to help traders identify high-probability trading opportunities.
The indicator operates using a separate window that displays two lines.
One line alternates between red and blue to reflect directional bias, while the second green line acts as a reference for trend interaction.
When these lines intersect, trade signals are generated.
On the main chart window, the indicator plots blue upward arrows for bullish opportunities and red downward arrows for bearish setups.
These arrows are generated only when specific volatility and trend conditions align, helping reduce false signals.
Because the Volatility Hyper Trend indicator does not repaint, traders can rely on its signals for consistent decision-making.
Free Download
Download the “volatility-hypertrend.ex4” MT4 indicator
Key Features
- Measures volatility and trend direction simultaneously.
- Non-repainting signals for reliable trade execution.
- Clear buy and sell arrows on the price chart.
- Dual-line confirmation within a separate indicator window.
- Suitable for scalping, day trading, and swing trading.
Indicator Chart
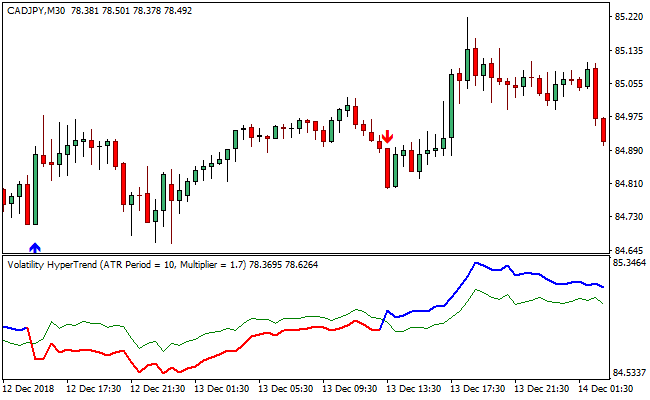
The Volatility Hyper Trend indicator appears in both a separate indicator window and the main price chart.
The indicator window shows a dual-colored trend line and a green confirmation line.
When these lines intersect, blue or red arrows appear on the price chart, highlighting potential buy and sell opportunities while reflecting current volatility conditions.

Guide to Trade with the Volatility Hyper Trend Indicator
Buy Rules
- Wait for a blue upward-pointing arrow to appear below the candlesticks.
- Confirm that the blue segment of the indicator line is active.
- Ensure volatility is expanding in the indicator window.
- Enter a buy trade at the close of the signal candle.
Sell Rules
- Wait for a red downward-pointing arrow to appear above the price bars.
- Confirm that the red segment of the indicator line is active.
- Check that volatility conditions support continuation.
- Enter a sell trade at the close of the signal candle.
Stop Loss Rules
- Set the stop loss at a fixed multiple of the current ATR value.
- Place the stop loss beyond the high or low of the signal candle.
- Exit the trade if the price does not move in your favor after several candles.
Take Profit Rules
- Take partial profits at the first strong volatility expansion.
- Target the next visible session high or low.
- Close the trade when volatility starts to contract.
MT4 Volatility Hyper Trend + Zone Trade Scalping Strategy
This strategy uses the Volatility Hyper Trend MT4 Indicator together with the Zone Trade Forex Scalper Indicator.
The Volatility Hyper Trend gives a directional trend signal: when it shows a blue arrow, the trend is up, and when it shows a red arrow, the trend is down.
The Zone Trade indicator paints candlesticks in green and red: a green candlestick means a buy signal, and a red candlestick means a sell signal.
By combining the two, this strategy filters for scalping entries that align with the trend and picks entries exactly when the Zone Trade candlesticks suggest a move.
This strategy is most useful on short-term timeframes like M1 or M5.
It is designed for scalpers who want to catch quick moves with both trend direction and entry precision, reducing false entries and improving risk control.
Buy Entry Rules
- The Volatility Hyper Trend indicator must show a blue arrow, signaling an uptrend.
- The Zone Trade indicator must plot a green candlestick, giving a buy signal.
- Enter a long trade at the close of the green candlestick when both indicators align.
- Place a stop loss just below the recent swing low on the same timeframe.
- Take profit at a small fixed target (for example, 8–15 pips), or exit when the Volatility Hyper Trend arrow flips red or when Zone Trade paints a red candlestick.
Sell Entry Rules
- The Volatility Hyper Trend indicator must show a red arrow, signaling a downtrend.
- The Zone Trade indicator must plot a red candlestick, giving a sell signal.
- Enter a short trade at the close of the red candlestick when both indicators agree.
- Set the stop loss just above the recent swing high on that timeframe.
- Take profit at a small fixed target (for example, 8–15 pips), or exit when the Hyper Trend arrow flips blue or a green Zone Trade candlestick appears.
Advantages
- Alignment of trend and entry signal improves trade quality.
- Scalping on short timeframes allows many potential trades per session.
- Clear rule-based stop loss and take profit make risk management easier.
- The Zone Trade candlestick signal is simple and visual.
- The strategy can work on many currency pairs because both indicators are generic.
Drawbacks
- In very choppy or low-volatility markets, the Hyper Trend arrow may flip often, leading to false or whipsaw trades.
- Fixed small profit targets may sometimes not capture the full move if volatility increases.
- Exits based on arrow flip or candlestick color change require fast reaction.
- Scalping demands high discipline and good execution, especially on short timeframes.
Example Case Study 1
On the EUR/USD M5 chart during the London session, the Volatility Hyper Trend indicator showed a blue arrow, signaling a bullish trend.
Shortly afterward, the Zone Trade indicator printed a green candlestick.
A long position was opened at the close of that candlestick.
The stop loss was set 6 pips below the recent swing low, and the take profit was placed at 12 pips.
Price moved up in a clean, quiet move and hit the take profit before any reversal, resulting in 12 pips profit.
Example Case Study 2
On GBP/JPY M1 during New York hours, the Hyper Trend showed a red arrow, signaling a strong downtrend.
The next Zone Trade candle turned red, giving a sell signal.
A short position was entered at the close of the candle, with a stop loss 8 pips above the recent high. A 15-pip take profit was used.
Price dropped swiftly, and a blue Hyper Trend arrow appeared just after the profit target was hit, indicating a trend shift.
The trade closed successfully for a 15-pip gain.
Strategy Tips
- Use this strategy during high-liquidity sessions like London and New York to improve the quality of trend and entry signals.
- Avoid entering when Hyper Trend arrows are close together or flipping quickly, and wait for a clear direction to reduce false signals.
- Consider using a trailing stop once a trade moves in your favor to help lock in partial profit without closing too early.
- Backtest the strategy on different currency pairs to identify which ones produce the most reliable signals.
- Always manage risk by scalping with a small position size and using stop losses to protect against large adverse moves.
Download Now
Download the “volatility-hypertrend.ex4” Metatrader 4 indicator
FAQ
Does the Volatility Hyper Trend indicator repaint?
No, the indicator does not repaint. Once a signal arrow appears, it remains fixed on the chart.
Can this indicator be used alone?
Yes, it can be used as a primary tool, though some traders may add price action confirmation.
What market conditions suit this indicator best?
The indicator performs best when volatility is present and trends are developing.
Summary
The Volatility Hyper Trend indicator offers traders a reliable way to combine volatility analysis with trend identification.
Its arrow-based signals simplify trade execution while maintaining consistency through non-repainting logic.
With its adaptability across trading styles and timeframes, the indicator provides practical value for traders seeking dependable entries and exits.


