About the WATR Simple Trend Indicator
The WATR Simple Trend indicator is a trend-following tool designed to show the current market direction in a straightforward and practical way.
It is built using concepts derived from the Average True Range, which allows it to adapt to changing market volatility while staying closely aligned with price.
The indicator is plotted directly on the price chart, where it alternates between two colored lines depending on trend direction.
A coral line appears below price during bullish conditions, while a dodger blue line forms above price during bearish phases.
This placement helps traders quickly identify whether buyers or sellers are in control.
Because it reacts to volatility rather than fixed price levels, the WATR Simple Trend indicator can also be used in breakout-style trading.
Expanding volatility often precedes strong directional moves, making this indicator useful beyond basic trend following.
The WATR Simple Trend indicator works across all currency pairs and timeframes.
Its simplicity makes it especially appealing to traders who prefer clean charts and decisive trend signals.
Free Download
Download the “watr.ex4” MT4 indicator
Key Features
- ATR-based trend calculation that adapts to market volatility.
- Displayed directly on the price chart for easy interpretation.
- Color-coded lines highlight bullish and bearish conditions.
- Can be used for trend following or breakout strategies.
- Suitable for multiple timeframes and trading styles.
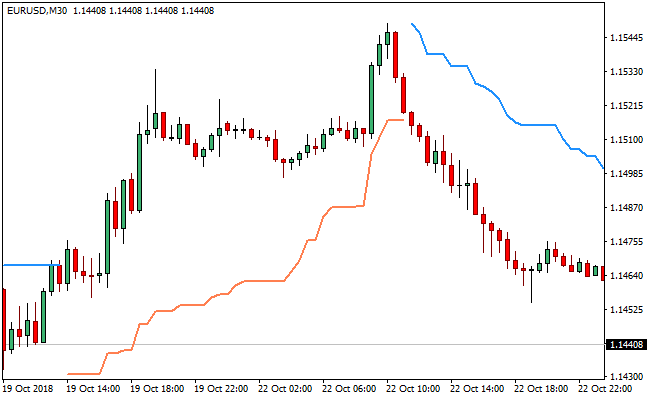
Indicator Chart
The WATR Simple Trend indicator is overlaid on the main price chart.
The chart shows alternating coral and dodger blue lines positioned below or above the candlesticks.
These lines indicate the prevailing trend direction and help traders stay aligned with ongoing market pressure.

Guide to Trade with the WATR Simple Trend Indicator
Buy Rules
- Wait for the WATR indicator to display a coral line.
- Confirm that the coral line is positioned below the candlesticks.
- Ensure price continues to respect the line without closing below it.
- Favor buy trades during expanding price movement.
Sell Rules
- Wait for the WATR indicator to display a dodger blue line.
- Confirm that the blue line is positioned above the candlesticks.
- Ensure price continues to trade below the line.
- Favor sell trades during increasing downside momentum.
Stop Loss Rules
- Place the stop loss on the opposite side of the WATR line.
- Allow extra room during volatile market conditions.
- Exit the trade if price decisively crosses the trend line.
Take Profit Rules
- Target recent swing highs or lows.
- Trail profits as long as the WATR line holds its position.
- Close the trade when the indicator flips color.
WATR Simple Trend + RSI Triple Stochastic Divergence Forex Day Trading Strategy
This strategy combines the WATR Simple Trend MT4 Indicator with the RSI Triple Stochastic Divergence Indicator MT4.
The WATR Simple Trend displays two lines: a dodger blue line, which signals a bearish trend, and a coral line, which signals a bullish trend.
Meanwhile, the RSI Triple Stochastic Divergence indicator plots a histogram:
When the bars are blue and above zero, it generates a buy signal; when they are red and below zero, it gives a sell signal.
By combining trend direction from WATR with momentum divergence from the RSI‑stochastic tool, this strategy filters entries and helps capture clean day trades in line with broader market strength.
This day trading method is designed primarily for intraday timeframes such as M15, M30, or H1.
It is well-suited for traders who want to take trades during active market hours (e.g., London or New York) while being selective: only entering when both the trend filter and the divergence signal agree.
This reduces noise, improves risk management, and helps identify high‑probability setups.
Buy Entry Rules
- The WATR Simple Trend coral line must be above the dodger blue line (i.e., the trend must be bullish).
- The RSI Triple Stochastic Divergence histogram must turn blue and be above zero, indicating a bullish divergence or strong upward momentum.
- Enter a long position at the close of the candle on which that blue histogram bar appears (provided the trend condition is still valid).
- Place the stop loss just below the most recent intraday swing low, on the same timeframe.
- Set take profit at a 1:1 risk‑reward ratio, or use a trailing stop if the coral line continues to rise and the trend remains strong.
Sell Entry Rules
- The WATR Simple Trend dodger blue line must be above the coral line (i.e., the trend must be bearish).
- The RSI Triple Stochastic Divergence histogram must turn red and drop below zero, signaling bearish momentum or divergence.
- Enter a short position at the close of the candle that produces the red bar, assuming the trend condition has not reversed.
- Place the stop loss just above the most recent high on the same timeframe (intraday swing high).
- Use a take profit target equal to your risk (1:1), or trail using a stop if the blue WATR line continues to maintain the downward trend.
Advantages
- The WATR Simple Trend line provides a clear and visual trend filter, reducing counter‑trend trades.
- The RSI Triple Stochastic Divergence histogram gives momentum entries with divergence potential, which can catch reversals or strong pushes.
- Works well on intraday charts, offering multiple trade opportunities each session.
- Defines risk and reward clearly through stop loss and take profit or trailing stop techniques.
- Helps avoid noise by requiring both trend and momentum confirmation before entering.
Drawbacks
- In choppy or sideways markets, the WATR lines may cross frequently, leading to ambiguous trend signals.
- Divergence signals may lag price when momentum shifts very quickly, causing late entries.
- Tight intraday stop losses may be hit frequently if volatility spikes suddenly.
- Trailing stops can be difficult to manage manually, especially on lower timeframes like M15.
- Requires continuous attention during the trading session to catch both trend alignment and histogram signals.
Example Case Study 1
On the EUR/USD M30 chart during the London‑New York overlap, the coral WATR line climbed above the dodger blue line, signaling a bullish trend.
After a mild pullback, the RSI Triple Stochastic Divergence histogram printed a blue bar above zero, indicating growing upward momentum.
A long trade was taken at the close of that bar. The stop loss was placed just below the most recent M30 swing low.
As the price moved higher, the coral line remained above the blue line, confirming trend strength, and a trailing stop was used to lock in profits.
The trade closed later in the day for a solid gain as EUR/USD extended its up-move.
Example Case Study 2
On GBP/JPY H1, the WATR Simple Trend dodger blue line rose above the coral line, indicating a bearish trend.
After some consolidation, the RSI Triple Stochastic Divergence histogram turned red and dropped below zero, giving a sell signal.
A short position was opened at the close of the red bar. The stop loss was placed just above the recent swing high, and the take profit was set equal to the risk taken.
Price declined over the next few hours, and the trade hit its take-profit target neatly.
This shows how momentum confirmation plus a trend filter can be effective on a volatile cross like GBP/JPY.
Strategy Tips
- Prefer sessions with stronger volatility for clearer trend and divergence signals.
- Avoid trading when WATR lines are very flat or intertwined because that’s often a sign of indecision rather than a strong trend.
- Use lower leverage and smaller position sizes on divergence trades, because divergence can produce false or weak moves.
- If a blue histogram bar appears but the WATR trend is weakening (coral line falling toward blue), consider passing on that trade.
- Maintain a trading journal to note which currency pairs (for example, USD/CHF, AUD/USD) respond best to this setup and during which hours.
Download Now
Download the “watr.ex4” Metatrader 4 indicator
FAQ
What type of trader benefits most from the WATR Simple Trend indicator?
The indicator suits traders who prefer simple trend-following logic and minimal chart clutter.
It works well for both discretionary and rule-based approaches.
Can the WATR indicator be used for breakout trading?
Yes, it can help identify breakout conditions when volatility expands and price starts moving away from key psychological or technical levels.
Is this indicator effective on lower timeframes?
It can be used on lower timeframes, though higher timeframes often provide more stable trend signals with fewer false flips.
Summary
The WATR Simple Trend indicator offers a practical way to follow market direction using volatility-based logic.
Its on-chart display and color changes make it easy to stay aligned with active trends.
With the ability to support both trend continuation and breakout-style setups, the indicator fits well into many trading plans.
Its simplicity, flexibility, and responsiveness make it a useful tool for traders seeking consistent directional guidance.


