
About the Multi Timeframe Bollinger Bands indicator
The Multi Timeframe Bollinger Bands indicator for MT4 allows traders to display Bollinger Bands from several timeframes on a single price view.
Instead of switching charts, you can instantly compare lower and higher timeframe volatility zones in one place.
This makes it easier to identify strong support and resistance areas, potential reversals, and price expansion phases.
The indicator works by overlaying Bollinger Bands from selected timeframes such as M5, M15, H1, H4, or even higher periods.
When multiple bands cluster together, price often reacts more strongly. When bands spread apart, volatility is increasing.
This approach helps traders align short-term entries with broader market context, improving timing and trade confidence.
It works on any currency pair and adapts well to changing market conditions without complex configuration.
Free Download
Download the “FXTT_MTF_BollingerBands.mq4” MT4 indicator
Key Features
- Displays Bollinger Bands from multiple timeframes on one price view.
- Selectable timeframes using simple checkbox options.
- Helps identify strong support and resistance zones.
- Highlights volatility expansion and contraction phases.
Indicator Chart
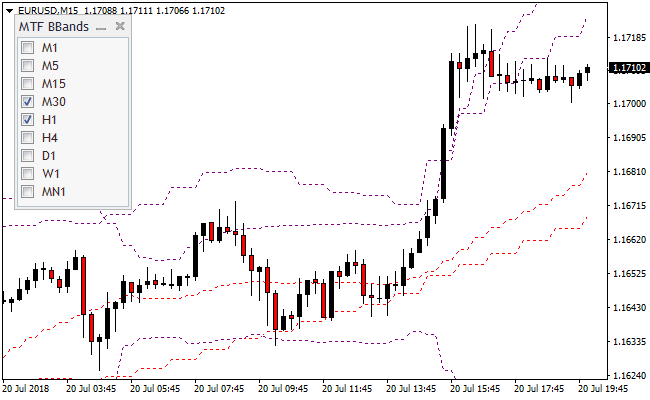
The image below shows the Multi Timeframe Bollinger Bands indicator applied to the price chart.
Multiple Bollinger Bands from different timeframes surround price action.
Areas where bands overlap often act as strong reaction zones.
Upper bands highlight potential sell pressure, while lower bands highlight potential buy interest based on volatility extremes.
Guide to Trade with Multi Timeframe Bollinger Bands
Buy Rules
- Wait for the price to approach or touch the lower Bollinger Band.
- Check if higher timeframe bands are flat or slightly rising.
- Enter a buy trade after price shows hesitation or slowdown near the band.
- Avoid buys when all bands slope sharply downward.
Sell Rules
- Wait for the price to approach or touch the upper Bollinger Band.
- Confirm that higher timeframe bands are flat or slightly declining.
- Enter a sell trade after price stalls near the upper band.
- Avoid sells when all bands slope strongly upward.
Stop Loss
- Place stop loss beyond the Bollinger Band used for entry.
- Allow extra room when higher timeframe bands are wide.
- Use recent price extremes as additional protection.
Take Profit
- Target the opposite Bollinger Band on the same timeframe.
- Exit fully if price reaches a higher timeframe band.
- Close the trade if volatility expands sharply against the position.
Multi-Timeframe Bollinger Bands and Ultimate Pro Scalper Forex Scalping Strategy
This MT4 scalping strategy combines multi-timeframe support and resistance analysis with precise entry timing using the Multi-Timeframe Bollinger Bands Indicator and the Ultimate Pro Scalper Indicator.
The Bollinger Bands indicator allows traders to visualize multiple bands from different timeframes on the same chart, helping identify key support and resistance levels.
The Ultimate Pro Scalper adds precise trade signals with green dots for buy entries and red dots for sell entries.
This combination is ideal for scalping on M1 and M5 charts, allowing traders to enter trades in the direction of short-term momentum while respecting key price levels from higher timeframes.
Buy Entry Rules
- Check that the current price is near or bouncing off a lower Bollinger Band from one or more higher timeframes.
- Wait for a green signal dot from the Ultimate Pro Scalper indicator.
- Enter a buy trade at the close of the candle where the green dot appears.
- Place a stop loss just below the nearest lower Bollinger Band or recent swing low.
- Take profit when the Ultimate Pro Scalper red dot appears or price reaches the upper Bollinger Band on the current timeframe.
Sell Entry Rules
- Check that the current price is near or rejected by an upper Bollinger Band from one or more higher timeframes.
- Wait for a red signal dot from the Ultimate Pro Scalper indicator.
- Enter a sell trade at the close of the candle where the red dot appears.
- Place a stop loss just above the nearest upper Bollinger Band or recent swing high.
- Take profit when the Ultimate Pro Scalper green dot appears or price reaches the lower Bollinger Band on the current timeframe.
Advantages
- Bollinger Bands across multiple timeframes help identify strong support and resistance zones.
- Ultimate Pro Scalper signals help time entries accurately for scalping.
- Combines trend and momentum for higher probability trades.
- Works well on M1 and M5 charts for fast scalping.
- Helps avoid trading against strong support/resistance zones.
Drawbacks
- Scalping requires fast execution and low spreads.
- Requires active monitoring to catch signal dots and band reactions.
- Multiple Bollinger bands may appear crowded, requiring practice to interpret correctly.
Example Case Study 1
On AUDUSD M1, the price approached the lower Bollinger Band from the 5-minute timeframe.
A green signal dot appeared from the Ultimate Pro Scalper, confirming a buy opportunity.
A trade was entered at candle close with a stop loss below the recent swing low.
Price moved upward, and the trade was closed when the red dot appeared, capturing a 12 pip scalp.
The higher timeframe bands helped identify a reliable support zone.
Example Case Study 2
On GBPJPY M5, the price touched the upper Bollinger Band from the 15-minute timeframe and showed signs of rejection.
A red signal dot appeared from the Ultimate Pro Scalper indicator.
A sell trade was entered at candle close with a stop loss above the swing high.
Price moved down to the lower band and the trade closed automatically at the green dot signal, resulting in a 27 pip gain.
Strategy Tips
- Use M1 and M5 charts for fast scalping and refer to higher timeframe bands for context.
- Let the Ultimate Pro Scalper dot signals dictate precise entry and exit points.
- Prioritize trades that align with bounce or rejection from higher timeframe Bollinger Bands.
- Maintain consistent position sizing due to the rapid nature of M1/M5 scalping.
- Partial profit-taking can be applied at intermediate band levels for conservative management.
- Keep a short trade journal to track which pairs respond best to this setup.
- Adjust stop losses based on band width and recent volatility.
Download Now
Download the “FXTT_MTF_BollingerBands.mq4” MT4 indicator
FAQ
What makes this Bollinger Bands indicator different?
It displays multiple timeframe Bollinger Bands together, allowing traders to compare volatility and key levels without changing charts.
Which timeframes should I enable?
Most traders combine one lower timeframe for entries with one or two higher timeframes for context, such as M15 with H1 or H4.
Is this indicator better for range or trend markets?
It performs best during ranging or slow-trending markets, where price frequently reacts to Bollinger Band extremes.
Summary
The Multi Timeframe Bollinger Bands indicator gives traders a practical way to read volatility and price extremes across multiple timeframes.
By combining Bollinger Bands into one view, it improves awareness of support, resistance, and potential turning points.
The indicator adapts to different trading styles and market conditions, making it a flexible tool for traders who want better context and more controlled entries.


