
About the Multi-Timeframe Triple Moving Average Indicator
The Multi-Timeframe Triple Moving Average indicator for MT4 provides buy and sell signals based on a triple moving average crossover system.
It uses a fast, middle, and slow moving average to identify trend direction and potential entry points.
Traders can activate the indicator on multiple timeframes, including 1-minute, 5-minute, 15-minute, 30-minute, 1-hour, 4-hour, 1-day, and 1-month charts.
This allows quick verification of trends across higher or lower timeframes while trading on a preferred chart.
Buy signals occur when the fast MA crosses above the middle and slow MAs, and the middle MA is above the slow MA.
Sell signals occur when the fast MA crosses below the middle and slow MAs, and the middle MA is below the slow MA. Trades can be closed at opposite signals or using your preferred exit method.
This indicator works for scalping, day trading, swing trading, and position trading, providing a versatile tool to align entries with the prevailing trend across multiple timeframes.
Free Download
Download the “FXTT_MTF_TripleMA.mq4” MT4 indicator
Key Features
- Generates buy and sell signals based on triple moving average crossovers.
- Fast, middle, and slow moving averages can be adjusted for strategy customization.
- Helps confirm trends across higher or lower timeframes for better entry timing.
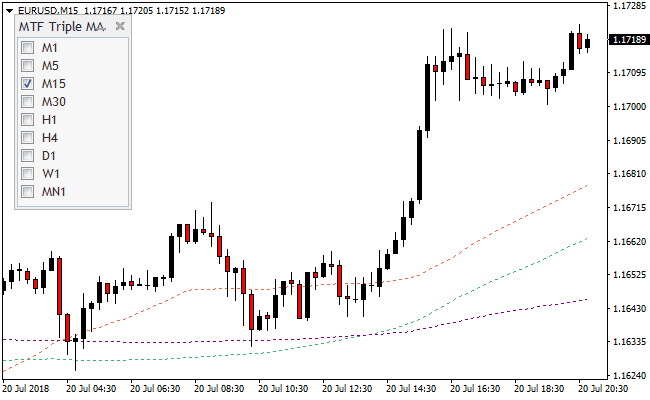
Indicator Chart
The Multi-Timeframe Triple Moving Average indicator appears directly on the main price area.
It plots fast, middle, and slow moving averages and shows signals based on crossovers.
Traders can see the trend direction clearly across multiple timeframes.
Guide to Trade with Multi-Timeframe Triple Moving Average Indicator
Buy Rules
- Ensure the fast MA is above the middle and slow MAs, and the middle MA is above the slow MA.
- Confirm trend direction on higher timeframes using the indicator’s checkboxes.
- Open a buy trade when all crossover conditions align.
- Avoid trades against the dominant trend on higher timeframes.
Sell Rules
- Ensure the fast MA is below the middle and slow MAs, and the middle MA is below the slow MA.
- Confirm trend direction on higher timeframes using the indicator’s checkboxes.
- Open a sell trade when all crossover conditions align.
- Avoid trades against the dominant trend on higher timeframes.
Stop Loss
- Set the stop below the most recent consolidation zone for buy trades.
- Set the stop above the most recent consolidation zone for sell trades.
- Trail the stop along the slow MA to lock in profits as the trend develops.
- Exit early if price closes beyond the slow MA in the opposite direction.
Take Profit
- Close buy trades near prior resistance levels or areas where price previously stalled.
- Close sell trades near prior support levels or areas where price previously reversed.
- Use a dynamic approach by scaling out partial profits as the price approaches the slow MA.
- Exit fully if the indicator signals a crossover in the opposite direction on the same timeframe.
Multi-Timeframe Triple Moving Average and Turbo JRSX MT4 Strategy
This MT4 strategy combines trend confirmation across multiple timeframes with momentum entries using the Multi-Timeframe Triple Moving Average Indicator and the Turbo JRSX Indicator.
The triple moving average indicator utilizes fast, middle, and slow moving averages, allowing it to display signals from multiple timeframes.
This allows traders to quickly confirm trends on higher timeframes before taking trades on lower ones.
The Turbo JRSX indicator provides clear momentum signals with a red line indicating bullish conditions and a green line indicating bearish conditions.
Together, these indicators help traders align entries with trend and momentum, making it suitable for scalping, day trading, and swing trading.
This strategy works best on M5 and M15 charts for intraday trading, but can be adapted for higher timeframes to accommodate swing trades.
It is ideal for traders looking for structured entries and trend confirmation across timeframes, ensuring trades align with overall market direction.
Buy Entry Rules
- Ensure the triple moving averages on the current chart timeframe are in bullish alignment (fast above middle, middle above slow).
- Check the higher timeframe trend using the indicator’s timeframe checkboxes to confirm the overall bullish direction.
- Wait for the Turbo JRSX red line to appear, signaling bullish momentum.
- Enter a buy trade at the close of the candle when the red line confirms the entry.
- Place a stop loss below the recent swing low or below the slow moving average.
- Take profit when the Turbo JRSX line changes from red to green.
Sell Entry Rules
- Ensure the triple moving averages on the current chart timeframe are in bearish alignment (fast below middle, middle below slow).
- Check the higher timeframe trend to confirm the overall bearish direction.
- Wait for the Turbo JRSX green line to appear, signaling bearish momentum.
- Enter a sell trade at the close of the candle when the green line confirms the entry.
- Place a stop loss above the recent swing high or above the slow moving average.
- Take profit when the Turbo JRSX line changes from green to red.
Advantages
- Multi-timeframe confirmation helps reduce countertrend trades.
- Turbo JRSX momentum lines provide clear entry signals.
- Works for scalping, day trading, and swing trading.
- Reduces guesswork by confirming trends on higher timeframes before entering.
- Simple to follow with visual cues and clear alignment rules.
- Applicable across multiple currency pairs without changing the default settings.
Drawbacks
- Trend alignment across multiple timeframes can delay entries on fast-moving markets.
- Requires consistent monitoring to catch short-term entries.
- Stop loss and take profit management is essential to avoid small reversals eroding profits.
Example Case Study 1
On USDCHF M5, the triple moving averages were aligned bullish on both the 5-minute and 15-minute charts.
The Turbo JRSX red line appeared, confirming bullish momentum.
A buy trade was opened at candle close.
The position remained open until the JRSX line changed from red to green, closing the trade with a 27 pip gain.
Multi-timeframe trend confirmation helped maintain confidence during minor pullbacks.
Example Case Study 2
On EURJPY M15, the triple moving averages showed bearish alignment on the M15 and H1 charts.
The Turbo JRSX green line appeared, signaling bearish momentum.
A sell trade was entered at candle close.
The trade was closed automatically when the JRSX line switched from green to red, making a 32 pip profit while capturing the main downward movement.
Trend alignment prevented early entries against the primary direction.
Strategy Tips
- Always confirm the higher timeframe trend to avoid trading against the main market direction.
- Use M5 and M15 for intraday setups and H1 for swing trades.
- Partial profit-taking at key levels can help lock in gains while letting trends run.
- Wait for candle close and Turbo JRSX confirmation before entering trades.
- Focus on high liquidity pairs to reduce slippage and spread costs.
- Adjust stop loss based on recent swing highs and lows rather than fixed pips.
- Track which pairs respond best to this setup and prioritize them in active sessions.
- Keep a trading log to refine alignment rules and momentum timing for each pair.
Download Now
Download the “FXTT_MTF_TripleMA.mq4” MT4 indicator
FAQ
Can I use multiple timeframes simultaneously?
Yes. The indicator allows you to activate signals from other timeframes with checkboxes to confirm trend direction across charts.
Which types of trading is it suitable for?
It is suitable for scalping, day trading, swing trading, and position trading, as signals can be analyzed across multiple timeframes.
Can I adjust the moving averages?
Yes. Fast, middle, and slow MAs can be customized to fit your preferred strategy or trading style.
Summary
The Multi-Timeframe Triple Moving Average indicator provides clear crossover-based buy and sell signals while allowing trend verification across multiple timeframes.
It helps traders align entries with both short-term and higher-timeframe trends.
By combining multiple timeframes, traders can filter false signals and increase confidence in their trades.


