
About the Multi-Timeframe Trend Dashboard Indicator
The Multi-Timeframe Trend Dashboard indicator for MetaTrader 4 is designed to give traders a fast and reliable overview of trend direction across multiple timeframes.
It processes information from indicators such as Stochastic, moving average crosses, MACD, ADX, CCI, RSI, AC/DC, and PSAR.
Each calculation contributes to an overall directional reading. Results are displayed using directional arrows.
Green arrows indicate bullish conditions, while red arrows signal bearish conditions.
This approach helps traders align entries with broader market direction.
The dashboard is best used as a trend confirmation tool alongside price action or entry-based indicators.
Free Download
Download the “DK MultiTimeFrame Indicator.mq4” MT4 indicator
Key Features
- Analyzes trends across 6 different timeframes.
- Combines data from multiple technical indicators.
- Uses real-time market calculations.
- Green arrows signal bullish trend conditions.
- Red arrows signal bearish trend conditions.
- Supports any currency pair in MT4.
- Designed for trend confirmation and filtering.
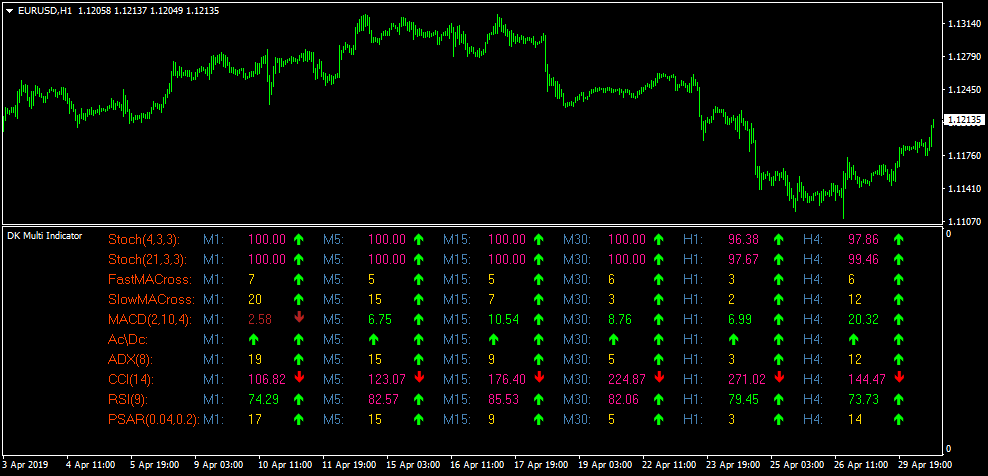
Indicator Chart
This chart example shows the Multi-Timeframe Trend Dashboard displayed on the trading chart.
The dashboard presents a grid of arrows for each timeframe, allowing traders to quickly assess whether market conditions favor buying or selling.
Guide to Trade with Multi-Timeframe Trend Dashboard Indicator
Buy Rules
- Check the dashboard for the selected currency pair.
- Confirm that most arrows across timeframes are green.
- Ensure higher timeframes support bullish conditions.
- Open a buy trade using your preferred entry method.
Sell Rules
- Check the dashboard for the selected currency pair.
- Confirm that most arrows across timeframes are red.
- Ensure higher timeframes support bearish conditions.
- Open a sell trade using your preferred entry method.
Stop Loss
- Place the stop loss below the most recent swing low for buy trades.
- Place the stop loss above the most recent swing high for sell trades.
- Reduce risk if lower timeframes start showing mixed arrows.
Take Profit
- Set take profit near the next higher-timeframe resistance for buy trades.
- Set take profit near the next higher-timeframe support for sell trades.
- Trail partial profits when trend alignment remains strong.
MT4 Multi-Timeframe Dashboard and Tether Line Forex Day Trading Strategy
This day trading strategy combines the Multi-Timeframe Trend Analysis Dashboard for MT4 with the Tether Line Forex Signals Indicator for MT4.
The dashboard provides a complete trend overview using five different timeframes and several technical indicators, while the Tether Line offers simple buy and sell signals using its blue and red directional lines.
This system works best for day traders on the M15, M30 and H1 charts.
The dashboard filters trend direction and strength, and the Tether Line provides clean entries inside that dominant trend.
The strategy is suitable for traders who want structure, clarity and a rule-based approach that reduces emotional decision-making.
Why This Strategy Works
The Multi-Timeframe Dashboard uses real-time data from multiple indicators, including Stochastic (4,3,3), Stochastic (21,3,3), fast and slow moving average crosses, MACD, ADX, CCI, RSI, PSAR and Ac/Dc.
When most of the arrows across multiple timeframes turn green, the pair is in a buy trend. When most turn red, the pair is in a sell trend.
Once the direction is confirmed, the Tether Line then gives the actionable entry signal.
A blue line indicates a buy entry, while a red line signals a sell.
This combination removes guesswork from day trading: one indicator selects the trend, the other pinpoints timing.
Buy Entry Rules
- Check the Trend Dashboard: most arrows across the monitored timeframes should be green.
- Ensure higher timeframes like H1 or H4 show clear bullish alignment.
- Wait for the Tether Line to turn blue.
- Enter a buy trade at the close of the signal candle.
- Set your stop loss below the nearest swing low.
- Aim for a 1:2 risk-to-reward or exit at the next strong resistance area.
Sell Entry Rules
- Check the Trend Dashboard: most arrows across the timeframes must be red.
- Confirm bearish structure on higher timeframes.
- Wait for the Tether Line to turn red.
- Enter a sell trade at the close of the signal candle.
- Place the stop loss above the recent swing high.
- Take profit at a 1:2 risk-to-reward or at the next support level.
Advantages
- Clear trend confirmation using five timeframes.
- Simple entry signals using the Tether Line color changes.
- Reduces false trades by requiring two indicators to agree.
- Suitable for day trading with minimal chart clutter.
- Works on major currency pairs and gold.
Drawbacks
- Waiting for dashboard alignment can reduce the number of trades.
- Strong news events can override dashboard signals temporarily.
- Late entries may occur if the Tether Line reacts after a sharp move.
Example Case Study 1
On EURUSD M30, the Trend Dashboard showed strong bullish alignment.
Four out of five timeframes displayed green arrows, including M30, H1 and H4.
The Tether Line was still flat at first, but as the price broke out of a small consolidation, it turned blue.
A buy trade was placed at the close of the candle.
The stop loss was positioned below the consolidation low.
Price pushed upward slowly but steadily throughout the session, reaching a gain of around 42 pips.
As the dashboard remained mostly green but the Tether Line began flattening, the trade was closed, securing the majority of the upward move.
Example Case Study 2
On GBPUSD M15, the dashboard showed strong bearish pressure with almost all arrows red across M15, M30 and H1.
The Tether Line confirmed the move by turning red after a brief retracement.
A sell entry was taken on the candle close after the red line appeared.
The stop loss was set above the recent minor high.
Volatility increased as the New York session started, and the pair dropped quickly, reaching about 38 pips in profit.
When the Tether Line began turning sideways and the M15 arrow flickered, the trade was closed to lock in gains before a reversal began forming.
Strategy Tips
- Only trade when at least three timeframes on the dashboard agree in one direction.
- The best results come from major pairs with clean intraday movement.
- Avoid trading during the first minutes of high-impact news.
- Use trailing stops to capture extended moves during trending market conditions.
- Focus on the London and New York sessions for the strongest signals.
Download Now
Download the “DK MultiTimeFrame Indicator.mq4” Metatrader 4 indicator
FAQ
Which indicators are used inside the dashboard?
The dashboard combines Stochastic settings, moving average crosses, MACD, ADX, CCI, RSI, AC/DC, and PSAR to form its trend readings.
How many timeframes does the indicator analyze?
It analyzes 6 different timeframes simultaneously, helping traders judge short-term and higher-timeframe alignment.
Should this indicator be used alone?
No. It works best when combined with entry tools such as price action, breakout systems, or momentum indicators.
Summary
The Multi-Timeframe Trend Dashboard MT4 indicator offers traders a practical way to monitor trend direction across several timeframes in one place.
By combining multiple technical indicators, it reduces the need for repetitive chart analysis.
The arrow-based display helps traders stay aligned with prevailing market direction and avoid counter-trend trades.
While it does not generate precise entries on its own, it significantly improves decision-making when paired with complementary trading tools.


