
About the DPO Buy/Sell Histogram Indicator
The DPO Buy Sell Histogram indicator for MT4 is a short-term momentum oscillator designed to highlight directional pressure without long-term trend noise.
It is based on the Detrended Price Oscillator and focuses on recent price cycles rather than extended market moves.
The indicator plots a dual-colored histogram that fluctuates above and below a zero level.
Blue bars appear above the zero line and reflect bullish short-term momentum.
Red bars appear below the zero line and reflect bearish short-term momentum.
Because the DPO removes longer-term trend influence, it performs best when combined with a higher-timeframe trend filter.
Many traders pair it with a 200-period moving average or Bollinger Bands to stay aligned with market direction and avoid countertrend setups.
Free Download
Download the “dpo-histogram-indicator.ex4” MT4 indicator
Key Features
- Dual-colored histogram for short-term momentum analysis.
- Zero-line logic for bullish and bearish bias.
- Well designed for scalping and intraday trading.
- Designed to be used with a trend filter.
Indicator Chart
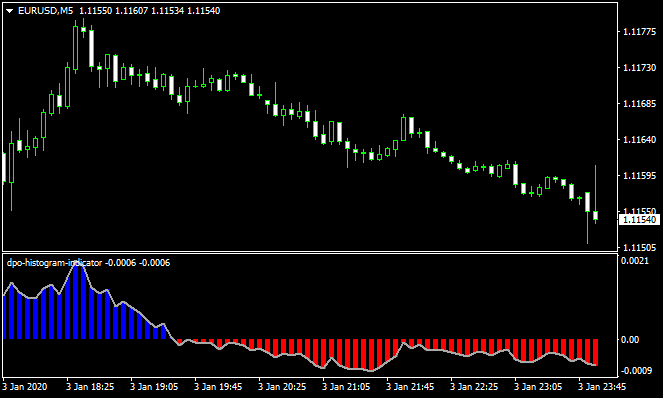
DPO Buy Sell Histogram indicator displayed on an MT4 chart with blue and red histogram bars.
The chart shows momentum shifts as the histogram expands above or below the zero line.
Traders use these changes to time entries in the direction of the prevailing trend.
Guide to Trade with DPO Buy Sell Histogram Indicator
Buy Rules
- Confirm the higher-timeframe trend is bullish using a moving average or similar tool.
- Wait for the DPO histogram to print blue bars above the zero line.
- Enter a buy trade when a new blue bar forms after a brief pullback.
Sell Rules
- Confirm the higher-timeframe trend is bearish using a trend filter.
- Wait for the DPO histogram to print red bars below the zero line.
- Enter a sell trade when a new red bar forms after a corrective move.
Stop Loss
- Place the stop loss 1-3 pips below the most recent swing low for buy trades.
- Place the stop loss 1-3 pips above the most recent swing high for sell trades.
- Use a fixed pip stop based on average volatility if preferred.
Take Profit
- Set take profit at the next support or resistance level.
- Exit the trade if the histogram contracts or changes color.
- Use a fixed risk-to-reward ratio such as 1:1 or 1:1.5.
- Consider partial profits during strong momentum moves.
DPO Histogram Indicator + Scalper Signal MT4 Forex Scalping Strategy
This MT4 scalping strategy uses two indicators: the DPO Buy/Sell Histogram and the Scalper Signal.
The DPO histogram paints blue bars when the short‑term trend is up and red bars when the trend is down.
The Scalper Signal gives precise entry points: a green arrow for buys and a red arrow for sells.
By combining the two, the strategy filters entries for trend direction and timing, making it very effective for fast trades on M1 and M5 charts.
Buy Entry Rules
- Wait for the DPO histogram to turn blue, signaling a bullish short-term trend.
- Confirm a green arrow from the Scalper Signal appears after or around the time of the blue bars.
- Enter long on the close of the candle that generates the green arrow.
- Place a stop loss 5–12 pips below the most recent swing low, depending on your chosen pair and timeframe.
- Set a take profit target: on M1 aim for 8–15 pips, on M5 aim for 15–25 pips.
Sell Entry Rules
- Wait for the DPO histogram to turn red, signaling a bearish short-term trend.
- Confirm a red arrow from the Scalper Signal appears.
- Enter short on the close of the candle that prints the red arrow.
- Place a stop loss 5–12 pips above the recent swing high.
- Set a take profit target: 8–15 pips on M1, or 15–25 pips on M5.
Advantages
- Combines trend‑direction filtering with precise entries.
- Very suitable for scalping thanks to tight stop losses and fast signals.
- Helps avoid counter-trend entries by requiring DPO confirmation.
- Scalper arrows give clear entry timing, reducing guesswork.
- Works on major and volatile currency pairs for good opportunity frequency.
Drawbacks
- In very choppy or low‑volatility markets, the histogram may flip often, causing false signals.
- Because take-profit targets are small, slippage or spreads can erode profit.
- Requires fast execution and constant attention, especially on M1.
Example Case Study 1
On EURUSD M1 during the European morning session, the DPO histogram shifted from red to blue, signaling that the short‑term trend direction was turning bullish.
At almost the same moment, the Scalper Signal indicator painted a green arrow.
A buy trade was entered at 1.1062 with a stop loss at 1.1053 (9 pips) and a take profit set for 12 pips at 1.1074.
Price moved upward quickly, and the take profit was reached within a few candles, resulting in a +12 pip gain.
Example Case Study 2
On GBPJPY M5 during the New York session, the DPO histogram turned red, signaling bearish short-term momentum.
Shortly afterward, a red arrow appeared on the Scalper Signal.
A sell trade was taken at 153.45, with a stop loss placed at 153.57 (12 pips) and a take profit of 20 pips at 153.25.
The pair slid down steadily, reaching the target after three candles, delivering a +20 pip scalp.
Strategy Tips
- Use this strategy during high‑liquidity sessions, such as London and New York, where price moves are more reliable.
- Avoid trading when spreads widen, such as during low-volume times or broker news spikes.
- Stick to currency pairs with good volatility like EURUSD, GBPJPY, AUDUSD, or USDJPY for more consistent scalping setups.
- If many signals appear but the histogram is weak or barely above/below zero, skip those trades — they are higher risk.
Download Now
Download the “dpo-histogram-indicator.ex4” Metatrader 4 indicator
FAQ
Is the DPO Buy Sell Histogram a trend indicator?
No. It measures short-term momentum and removes longer-term trend influence.
A separate trend indicator should be used for direction.
Which timeframe is best for this indicator?
Lower timeframes such as M5 to H1 work well for scalping and intraday trading.
Higher timeframes can also be used with proper filtering.
Why does the histogram change colors often?
Frequent color changes reflect low momentum or ranging conditions where trading should be reduced.
Summary
The DPO Buy Sell Histogram indicator for MT4 is a practical tool for traders who focus on short-term price movement.
Its color-based histogram makes momentum shifts easy to read and helps refine trade timing.
When combined with a reliable trend filter and disciplined risk control, the indicator can improve entry accuracy and consistency.
It is simple to use, flexible across markets and suitable for active trading styles.


