
The Williams Accumulation/Distribution (WAD) indicator for Metatrader 5 is developed by Larry Williams and helps traders identify potential trend reversals.
The indicator is displayed in a dedicated chart window as a sea-green colored line.
How to identify potential trend reversals using the Williams Accumulation/Distribution indicator?
Divergences found between the WAD indicator and the currency pair’s price could trigger a trend reversal.
Bearish trend reversal:
The currency pair’s price is making new highs but the Williams Accumulation/Distribution indicator is declining, this may indicate a bearish trend reversal signal.
Always confirm the bearish trend reversal with additional indicators.
Bullish trend reversal:
The currency pair’s price is making new lows but the Williams Accumulation/Distribution indicator is advancing, this may indicate a bullish trend reversal signal.
Always confirm the bullish trend reversal with additional indicators.
The indicator allows customizing the following settings and parameters: color.
Gain confidence in utilizing the Williams Accumulation/Distribution indicator and test it first on a demo account for an extended time.
Download Indicator 🆓
williams_accumulation_distribution.mq5 Indicator (MT5)
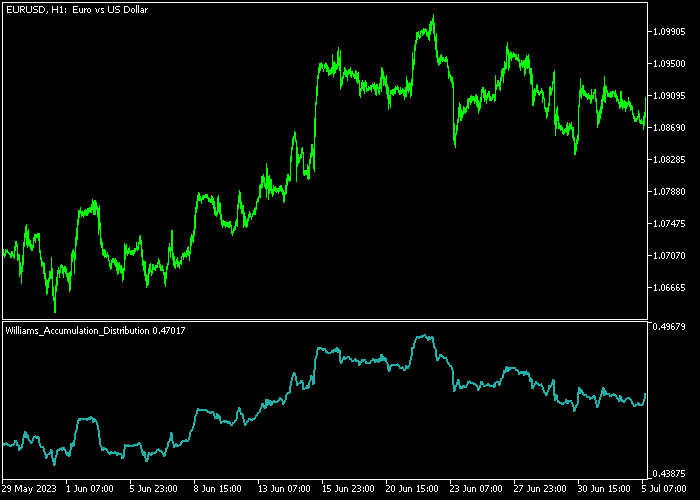
Chart Example
The picture below illustrates what the Williams Accumulation/Distribution indicator looks like when applied to the MT5 chart.
Download Now 🆓
williams_accumulation_distribution.mq5 Indicator (MT5)
Frequently Asked Questions
How Do I Install This Custom Indicator On Metatrader 5?
- Open the MT5 trading platform
- Click on the File menu button located at the top left part of the platform
- Click on Open Data Folder > MQL5 folder > Indicators
- Copy the williams_accumulation_distribution.mq5 indicator file in the Indicators folder
- Close and restart the trading platform
- You will find the indicator here (Navigator window > Indicators)
- Drag the indicator to the chart to get started with it!
How Do I Edit This Indicator?
- Click in the open chart with your right mouse button
- In the dropdown menu, click on Indicator List
- Select the indicator and click on properties
- Now you can edit the inputs, colors, levels, scale and visualization
- Finally click the OK button to save the new configuration


