About the iMACD Histogram Indicator
The iMACD Histogram Indicator for MetaTrader 4 is a trend-following tool built on the classic MACD trading concept.
Instead of displaying traditional MACD lines, it converts momentum data into a color-coded histogram that highlights bullish and bearish market conditions in real time.
The indicator is displayed below the main price chart and uses two colors to represent trend direction.
Blue histogram bars signal bullish momentum, while red histogram bars indicate bearish momentum.
This makes it easy for traders to identify trend changes without overloading the chart.
It can be used on its own for fast-paced trading or combined with other technical tools to confirm entries and improve trade quality.
Free Download
Download the “iMACD_Advanced_Histo_v1.0.ex4” MT4 indicator
Key Features
- MACD-based histogram buy and sell indicator.
- Blue bars represent bullish trend conditions.
- Red bars represent bearish trend conditions.
- Works on all MT4 timeframes.
- Compatible with all currency pairs and symbols.
- Suitable for scalping, day trading, and swing trading.
Indicator Chart
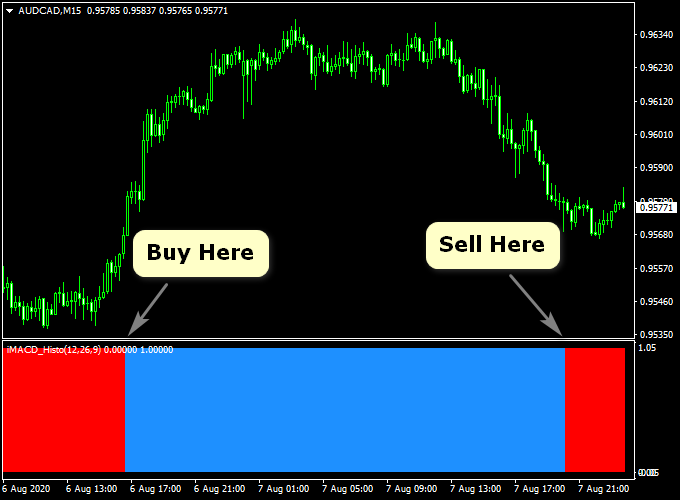
The chart below shows the iMACD Histogram Indicator applied to a forex price chart.
The first blue or red bar often marks the beginning of a new trend phase, helping traders identify potential entry and exit points.

Guide to Trade with the iMACD Histogram Indicator
Buy Rules
- The iMACD Histogram prints its first blue bar.
- The overall momentum turns bullish.
- The trade is opened at the start of the blue histogram trend.
Sell Rules
- The iMACD Histogram prints its first red bar.
- The overall momentum turns bearish.
- The trade is opened at the start of the red histogram trend.
Stop Loss
- Place the stop loss 3 pips below the nearest support for buy trades.
- Place the stop loss 3 pips above the nearest resistance for sell trades.
- Traders may also apply a custom stop loss strategy.
Take Profit
- Close the trade when the histogram changes to the opposite color.
- Use a fixed pip target based on the timeframe.
- For example, 30 pips on M15 or 15 pips on M1.
iMACD Histogram + JJN Big Trend Forex Strategy for MT4
This forex strategy combines the iMACD Histogram Buy/Sell Forex MT4 Indicator with the JJN Big Trend Forex Indicator for MT4.
The iMACD Histogram shows short-term momentum with blue bars for buy signals and red bars for sell signals.
The JJN Big Trend indicator identifies the overall trend for multiple currency pairs and displays it in a mini dashboard.
A buy setup is confirmed when at least four out of five dots are green, while a sell setup is confirmed when four or more dots turn red.
This strategy works well on M15 and H1 charts and is suitable for traders looking to combine trend-following with short-term momentum signals.
Buy Entry Rules
- The iMACD Histogram turns blue, signaling bullish momentum.
- The JJN Big Trend dashboard shows at least four green dots, confirming strong trend alignment.
- Enter a buy trade at the close of the confirming candle.
- Place stop loss below the recent swing low, usually 10–20 pips on M15 or 25–35 pips on H1.
- Set take profit at 20–30 pips on M15 or 50–60 pips on H1, or exit when the histogram turns red or the dashboard shows fewer than four green dots.
Sell Entry Rules
- The iMACD Histogram turns red, signaling bearish momentum.
- The JJN Big Trend dashboard shows at least four red dots, confirming a strong downtrend.
- Enter a sell trade at the close of the confirming candle.
- Place stop loss above the recent swing high, typically 10–20 pips on M15 or 25–35 pips on H1.
- Take profit at 20–30 pips on M15 or 50–60 pips on H1, or exit when the histogram turns blue or fewer than four dots remain red.
Advantages
- Combines momentum with multi-pair trend confirmation for higher probability trades.
- The mini dashboard allows easy monitoring of trend strength across multiple pairs.
- Visual signals are straightforward and quick to interpret, suitable for both beginners and experienced traders.
- Works well on M15 and H1 charts for intraday trading with clear entries and exits.
- Helps avoid trading against strong trends, reducing the likelihood of false entries.
Drawbacks
- Requires monitoring multiple timeframes for proper risk management.
- The trend dashboard can lag slightly on fast reversals, potentially missing early entry opportunities.
- Less effective on pairs with low liquidity or erratic movements, as histogram signals can be choppy.
Case Study 1: EURUSD M15 Trade
During the London session, the iMACD Histogram turned blue while the JJN Big Trend dashboard showed four green dots for EURUSD.
A buy entry at 1.1035 with a 22-pip stop loss moved to 1.1080, capturing 45 pips before the histogram turned red and the dashboard showed fewer than four green dots, signaling an exit.
Case Study 2: GBPUSD H1 Trade
In the New York session, the iMACD Histogram turned red, and the JJN Big Trend dashboard displayed four red dots.
A sell entry at 1.2480 with a 45-pip stop loss dropped to 1.2400, securing 80 pips before the histogram changed to blue and the trend dashboard showed fewer than four red dots.
Strategy Tips
- Check the trend alignment on multiple pairs using the dashboard to avoid trading against strong moves.
- Adjust stop loss and take profit levels based on pair volatility and session activity.
- Be cautious during high-impact news events that can cause sudden reversals.
- Consider partial profit-taking if the histogram shows early signs of weakening while the dashboard remains strong.
- Keep a trading journal to monitor which pairs perform best under this combined strategy.
Download Now
Download the “iMACD_Advanced_Histo_v1.0.ex4” Metatrader 4 indicator
FAQ
Is the iMACD Histogram indicator suitable for fast scalping?
Yes, the indicator performs well on lower timeframes such as M1, M5, and M15, where quick momentum shifts are common.
Can the indicator be used as a standalone strategy?
It can be traded on its own, especially for intraday setups. On higher timeframes, many traders prefer to add trend or support confirmation.
Are the indicator settings adjustable?
Yes, the input parameters can be modified to increase or decrease sensitivity depending on market conditions and trading style.
Summary
The iMACD Histogram Indicator for MT4 offers a clean and practical way to trade MACD-based momentum using color-coded trend signals.
Its simple design makes trend direction easy to follow without unnecessary complexity.
With support for all timeframes and currency pairs, the indicator adapts well to different trading approaches.
When combined with solid risk management and proper market context, it can become a reliable tool for identifying buy and sell opportunities.


