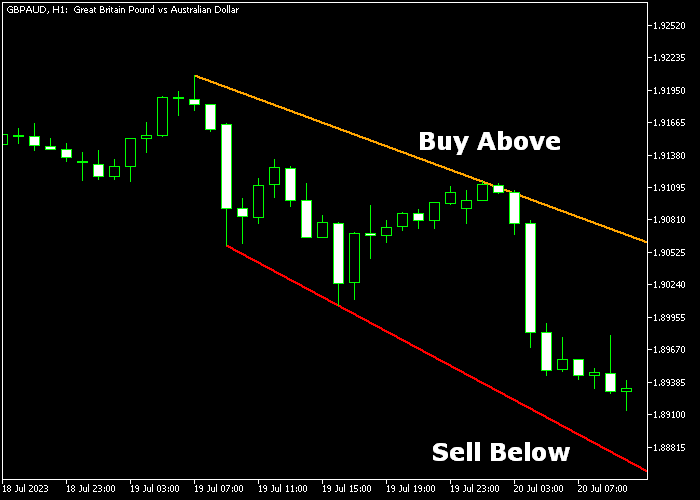
The Super Trend Line Channel indicator for Metatrader 5 analyzes the price chart and accurately plots a trend line channel based on the user’s chosen time frame.
The trend channel never lags the price, enabling traders to make timely decisions to buy when the price breaks above the channel or sell when it breaks below.
Here’s how it works:
- A candle closes above the orange-colored trend line channel creates a buy trade opportunity.
- A candle closes below the red-colored trend line channel generates a sell trade opportunity.
The indicator contains the following inputs and parameters: period, limit, up channel color, and down channel color.
Before using this technical indicator in live currency trading, it is recommended to practice and gain familiarity with it on a demo account.
Download Indicator
trendlinesday.mq5 Indicator (MT5)
Chart Example GBPAUD H1
The following chart shows how the Super Trend Line Channel indicator looks when applied to the MT5 chart.
How To Buy And Sell Using The Super Trend Line Channel Indicator?
Find a simple trading example below:
Buy Signal
- Buy a candle close above the orange-colored trend line channel line.
- Set a stop loss below the red-colored trend channel line.
- Close the buy trade for a risk/reward ratio of 1.5 or better.
- Alternatively, use your preferred take-profit method to close the buy trade.
Sell Signal
- Sell a candle close below the red-colored trend line channel line.
- Set a stop loss above the orange-colored trend channel line.
- Exit the sell trade for a risk/reward ratio of 1.5 or better.
- Alternatively, use your preferred take-profit method to close the sell trade.
Download Now
trendlinesday.mq5 Indicator (MT5)
Adaptive Channel Trend Wave System For Metatrader 5
This strategy blends the channel breakout signals from the Super Trend Line Channel Indicator with the adaptive trend smoothing of the AMA Wave Forex Indicator.
The combined system helps traders capture strong trend moves while filtering noise for better trade timing.
Indicators Used
- Super Trend Line Channel Indicator: Provides dynamic support and resistance levels via trend channels to identify breakout and pullback zones.
- AMA Wave Forex Indicator: Uses adaptive moving averages to highlight trend direction and momentum with smooth wave patterns.
Timeframes
Best used on M15, M30, and H1 charts for intraday and short-term trend trading.
Buy Entry Rules
- The AMA Wave indicator shows a clear bullish wave (e.g., price above the AMA wave or green wave color).
- Price breaks above the upper Super Trend Line Channel and closes outside the channel.
- Enter a long trade on the breakout candle close.
- Place a stop-loss below the mid or lower channel line or recent swing low.
- Target the next resistance or use a risk-reward ratio of 1.5 to 2.
Sell Entry Rules
- The AMA Wave indicator displays bearish waves (e.g., price below AMA wave or red wave color).
- Price breaks below the lower Super Trend Line Channel and closes outside the channel.
- Enter a short trade on the breakout candle close.
- Set stop-loss above the mid or upper channel line or recent swing high.
- Take profit near support or use fixed reward-to-risk levels.
Strategy Tips
- Confirm entries only when AMA Wave and channel breakout signals align.
- Avoid trades inside the channel or during sideways AMA wave movements.
- Use the channel lines as trailing stop guides once in profit.
Conclusion
The combination of the Super Trend Line Channel Indicator and the AMA Wave Forex Indicator creates a robust trend-following strategy.
It balances breakout precision with adaptive trend smoothing for more reliable trade signals.
Frequently Asked Questions
How Do I Install This Custom Indicator On Metatrader 5?
- Open the MT5 trading platform
- Click on the File menu button located at the top left part of the platform
- Click on Open Data Folder > MQL5 folder > Indicators
- Copy the trendlinesday.mq5 indicator file in the Indicators folder
- Close and restart the trading platform
- You will find the indicator here (Navigator window > Indicators)
- Drag the indicator to the chart to get started with it!


