
About the Cog RSI Histogram Indicator
The Cog RSI Histogram Forex indicator for MT4 is a signal-based trading tool that combines Center of Gravity calculations with RSI momentum.
This combination helps identify shifts in market direction with minimal chart clutter.
Once installed, the indicator appears in a separate window below the main price chart.
It displays a colored histogram that fluctuates above and below the zero level, making momentum changes easy to spot in real time.
The histogram alternates between blue and orange bars to indicate potential buy and sell conditions.
The indicator works across all currency pairs and time frames, offering flexibility for traders who prefer scalping, day trading, or swing trading approaches.
Free Download
Download the “cog-rsi-histogram.ex4″ indicator
Key Features
- Combines COG and RSI for momentum-based signals.
- Displays a clean histogram in a sub-window.
- Blue histogram bars indicate bullish conditions.
- Orange histogram bars indicate bearish conditions.
- Signals form around the neutral zero level.
- Works on any currency pair and time frame.
- Suitable for beginners and experienced traders.
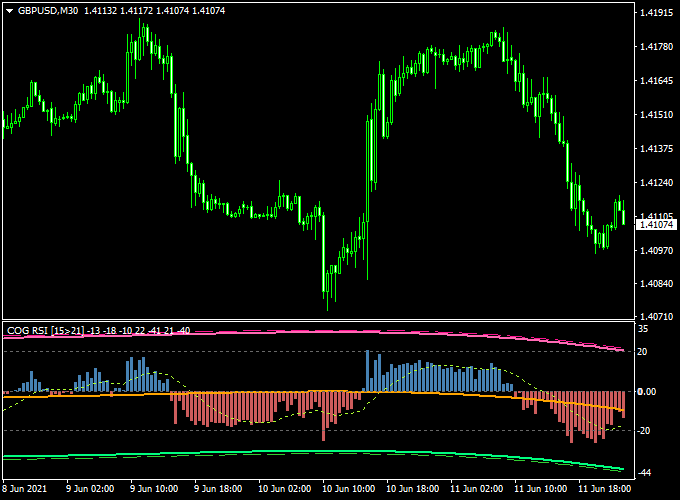
Indicator Chart
The chart shows the Cog RSI Histogram plotted beneath the price chart with alternating colored bars.
Histogram movements above and below the zero line help traders visualize momentum shifts and time entries more effectively.
Guide to Trade with Cog RSI Histogram
Buy Rules
- Wait for the histogram to change from orange to blue.
- Ensure the bar forms near or above the zero level.
- Open a buy trade at the close of the signal bar.
Sell Rules
- Wait for the histogram to change from blue to orange.
- Confirm the signal forms near or below the zero level.
- Open a sell trade at the close of the signal bar.
Stop Loss
- Place the stop loss beyond the most recent price swing.
- Adjust risk based on the active time frame and FX pair.
Take Profit
- Exit when the histogram changes to the opposite color.
- Alternatively, secure profits near key price reaction zones.
COG RSI Histogram + Flat Trend RSI Forex Scalping Strategy
The combination of the COG RSI Histogram Forex Signals Indicator for MT4 and the Flat Trend RSI Indicator for Forex MT4 forms a strong and simple scalping method for short-term traders.
This setup is ideal for traders who prefer fast-paced sessions on the M5 or M15 time frames.
It focuses on short but consistent trades during clear intraday trends, allowing traders to capture quick profits from short market bursts.
Both indicators are RSI-based, giving an accurate view of momentum strength and direction.
This scalping system works because it filters market noise effectively.
The COG RSI Histogram generates precise momentum-based signals, while the Flat Trend RSI confirms whether a move has enough power to continue.
When both indicators align, the probability of success increases, making this system effective for EURUSD, GBPUSD, and gold during the London and New York sessions.
Buy Entry Rules
- Wait for the COG RSI Histogram to turn blue, indicating a buy signal.
- Confirm that the Flat Trend RSI histogram also turns blue, showing a bullish market condition.
- Enter a buy position immediately after both indicators align on the same candle.
- Set the stop loss 10–15 pips below the recent swing low.
- Take profit when the COG RSI Histogram turns orange or when you reach 20–40 pips of profit.
Sell Entry Rules
- Wait for the COG RSI Histogram to turn orange, signaling bearish momentum.
- Confirm that the Flat Trend RSI histogram turns red, showing a downtrend.
- Open a sell position once both indicators confirm the same bearish signal.
- Set the stop loss 10–15 pips above the recent swing high.
- Take profit when the COG RSI Histogram turns blue or when the trade gains 20–40 pips.
Advantages
- Simple to follow and visually clear.
- Generates early entries during short-term market trends.
- Ideal for quick scalping on volatile currency pairs.
- Provides strong momentum confirmation with two RSI-based indicators.
- Useful for traders who prefer short time frames and fast results.
Drawbacks
- Requires active chart monitoring due to its short-term nature.
- Performance may drop in very low volatility conditions.
Case Study 1: EURUSD M5 Scalping Example
On the EURUSD M5 chart during the London open, the COG RSI Histogram turned blue, and the Flat Trend RSI also switched to blue.
The trader entered a buy trade at 1.0830.
Momentum strengthened immediately, and within 20 minutes, the price climbed to 1.0852, securing a 22-pip profit.
The exit was made when the COG RSI Histogram turned orange, signaling weakening momentum.
Case Study 2: GBPUSD M15 Short Setup
Later in the New York session, GBPUSD displayed an orange COG RSI Histogram while the Flat Trend RSI was red, confirming a bearish environment.
The entry was placed at 1.2695 with a 15-pip stop loss.
The price quickly fell to 1.2660 within the next hour, capturing a 35-pip move.
Both indicators later flipped to blue, marking a good point to exit.
The setup demonstrated how combining these two indicators can catch clean directional moves even on short time frames.
Strategy Tips
- Use this scalping system on major pairs such as EURUSD, GBPUSD, and USDJPY.
- Focus on high-volume trading hours for better price movement and lower spread impact.
- Combine with basic price action confirmation, such as small pullbacks or candle breakouts.
- Keep risk per trade below 2% to maintain consistent growth.
Download Now
Download the “cog-rsi-histogram.ex4” Metatrader 4 indicator
FAQ
What role does the zero level play?
The zero level acts as a momentum reference point. Signals near this level often mark early directional shifts.
Is this indicator more momentum-based or reversal-based?
It is primarily momentum-based but can capture early reversals when momentum begins to shift.
Can it be used with price action?
Yes. Many traders combine the histogram signals with support and resistance or candle patterns.
How often do signals appear?
Signal frequency depends on the selected time frame. Lower time frames generate more frequent signals.
Summary
The Cog RSI Histogram indicator for MT4 provides a straightforward way to trade momentum shifts using a clean visual layout.
Its color-based histogram simplifies signal interpretation.
The indicator adapts well to different trading styles and markets.
With proper confirmation and risk control, it can support consistent trading decisions.


