About the Ehlers Histogram Oscillator
The Ehlers Histogram Forex Oscillator for MT4 is a trend-focused signals indicator designed to help traders stay aligned with directional market movement.
It presents buy and sell conditions using a simple histogram format, making trend identification fast and practical.
Once applied to the chart, the indicator appears in a separate window below the main price action.
The histogram bars change color based on trend direction, allowing traders to see when bullish or bearish pressure dominates the market.
This oscillator performs best in trending conditions, where momentum remains consistent for extended periods.
It does not repaint its histogram bars, which makes it suitable for traders who rely on stable signals and disciplined execution.
The indicator can be used on any currency pair and time frame.
Free Download
Download the “ehlers-histogram-oscillator.ex4“ indicator
Key Features
- Trend-based histogram oscillator for MT4.
- Blue bars indicate bullish market conditions.
- Red bars indicate bearish market conditions.
- Appears in a separate window below the price chart.
- Does not repaint histogram bars.
- Works for scalping, day trading, and swing trading.
- Can be used as a standalone trading tool.
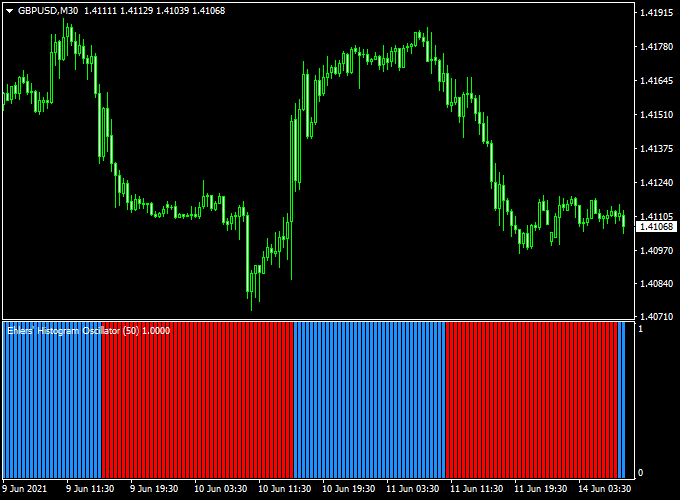
Indicator Chart
The chart shows the Ehlers Histogram Oscillator plotted beneath the main price chart.
Color changes in the histogram reflect shifts in trend direction, helping traders stay positioned with prevailing momentum.

Guide to Trade with Ehlers Histogram Oscillator
Buy Rules
- Wait for the first blue histogram bar to appear
- Confirm that price action supports upward movement
- Open a buy trade at the close of the signal bar
Sell Rules
- Wait for the first red histogram bar to appear
- Confirm that price action supports downward movement
- Open a sell trade at the close of the signal bar
Stop Loss
- Place the stop loss beyond the most recent swing level
- Allow slightly wider stops on higher time frames
Take Profit
- Exit the trade when the histogram changes to the opposite color
- Alternatively, secure profits near key price reaction areas
Ehlers Histogram + Best Forex Scalping Indicator MT4 Strategy
This scalping strategy utilizes the Ehlers Histogram Forex Oscillator for MT4 along with the Best Forex Scalping Indicator.
It’s designed for traders who like quick entries and exits, ideally on M5 or M15 time-frames.
You’ll want pairs with good volatility, such as EURUSD, USDJPY, and AUDUSD, during the London/New York overlap.
The idea is that the Ehlers Histogram provides trend direction while the scalping indicator gives the precise entry arrow.
The alignment of both increases your odds of a successful move.
Buy Entry Rules
- The Ehlers Histogram turns blue, indicating an upward trend.
- The Best Forex Scalping Indicator displays a blue arrow buy signal.
- Once both appear on the same or consecutive candles, open a buy trade.
- Set stop loss 8-12 pips below the recent swing low (on M5) or 12-18 pips on M15.
- Set take profit at 15-30 pips (M5) or 30-50 pips (M15), or exit when the Ehlers Histogram turns red or you see a red arrow on the scalping indicator.
Sell Entry Rules
- The Ehlers Histogram turns red, indicating a downward trend.
- The Best Forex Scalping Indicator displays a red arrow sell signal.
- Upon both signals aligning, open a sell trade.
- Set stop loss 8-12 pips above the recent swing high (M5) or 12-18 pips (M15).
- Set take profit at 15-30 pips (M5) or 30-50 pips (M15), or close when the Ehlers Histogram turns blue or you get a blue arrow from the scalping indicator.
Advantages
- Combines trend-filter (Ehlers Histogram) + precise entry signal (scalping indicator) for higher probability setups.
- Short-term trades mean less exposure to big drawdowns and market noise when used properly.
- Easy to scan: visual signs (histogram color + arrow) make entries simple to spot.
- Works well with major liquid pairs (EURUSD, USDJPY, AUDUSD) during active sessions.
Drawbacks
- In sideways or low-volatility markets, the histogram may switch colors frequently, and arrows may mislead, causing false entries.
- Requires active monitoring—scalping on M5/M15 demands quick decision-making and execution discipline.
- High spread or low liquidity (e.g., minor pairs or off-hours) can eat into profits or make stop losses ineffective.
- Psychologically tougher: many small trades mean emotional discipline is essential to avoid overtrading or revenge trades.
Case Study 1: EURUSD M5 Setup
During the London session, EURUSD on M5 had the Ehlers Histogram flip to blue.
Seconds later, the scalping indicator gave a blue arrow.
Trader entered a buy at 1.0980 with a stop loss at 1.0972 (8 pips) and a profit target of 20 pips.
Within 12 minutes price reached 1.1000, and the trader exited with +20 pips.
The histogram remained blue throughout the trade, and no red arrow appeared until after exit.
Case Study 2: AUDUSD M15 Setup
In the New York session, AUDUSD on M15 turned red on the Ehlers Histogram.
A red arrow appeared from the scalping indicator shortly after.
Entry was at 0.6750 with a stop loss at 0.6763 (13 pips) and a target of 35 pips.
Over the next 25 minutes price fell to 0.6715, and the trader locked in +35 pips.
The histogram then turned blue, prompting closure if not already managed manually.
Strategy Tips
- Prefer active sessions (London & New York) for best liquidity and volatility.
- Avoid entering trades during major news events unless you’re comfortable with potential spikes and slippage.
- Check higher time-frames (H1 or H4) for overall trend direction and preferably trade in the same direction as the higher time-frame trend.
- Maintain a trading log and analyse wins vs losses to maintain discipline and refine performance.
Download Now
Download the “ehlers-histogram-oscillator.ex4” Metatrader 4 indicator
FAQ
What type of market does this indicator perform best in?
The Ehlers Histogram Oscillator is designed for trending markets, where price maintains direction for extended periods of time.
How reliable are the histogram color changes?
The histogram bars do not repaint once they form, which allows traders to trust signals after the candle close.
Can this indicator be used for short-term trading?
Yes. On lower time frames it can be used for scalping, although signals will appear more frequently.
Is additional confirmation recommended?
While the indicator can be traded on its own, many traders combine it with price action or trend filters for added confidence.
Summary
The Ehlers Histogram Forex Oscillator for MT4 offers a simple way to follow market trends using color-based histogram signals.
Its non-repainting behavior supports consistent and rule-driven trading decisions.
The indicator adapts well across time frames and trading styles.
With proper confirmation and risk management, it can become a reliable trend-following tool.


