About the Candles Box Daily Market Session Indicator
The Candles Box Daily Market Session indicator for MT4 is designed to help traders understand daily market behavior through visual session data.
It highlights daily volatility and directional bias using colored background boxes directly on the chart.
Each trading day is represented by a colored box that reflects whether the market closed higher or lower.
In addition to direction, the indicator calculates and displays daily volatility in pips, giving traders a quick reference for expected price movement.
A compact information panel on the left side of the chart summarizes market session data in text format.
The indicator is fully customizable, allowing traders to adjust colors, visibility, and layout to match their trading preferences.
Free Download
Download the “candles-box-session-indicator.ex4” MT4 indicator
Key Features
- Displays daily market direction using colored background boxes.
- Calculates daily volatility in pips.
- Green boxes indicate bullish daily closes.
- Crimson boxes indicate bearish daily closes.
- Mini session panel displays text-based market information.
- Fully customizable appearance and settings.
- Useful for breakout and session-based strategies.
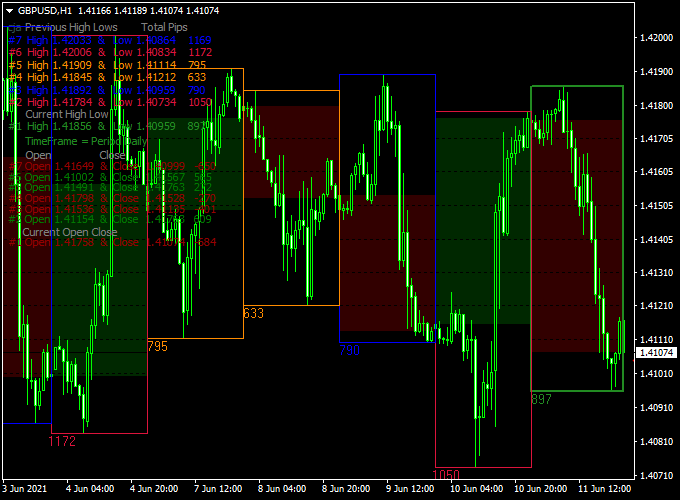
Indicator Chart
The chart shows the Candles Box indicator applied to the price chart with colored daily background boxes.
These boxes highlight the previous day’s high and low range, helping traders visually identify potential breakout levels and directional bias.

Guide to Trade with Candles Box Daily Market Session
Buy Rules
- Identify a green daily box indicating a bullish close.
- Mark the previous day’s high from the box range.
- Enter a buy trade when price breaks and holds above that high.
Sell Rules
- Identify a crimson daily box indicating a bearish close.
- Mark the previous day’s low from the box range.
- Enter a sell trade when price breaks and holds below that low.
Stop Loss
- Place the stop loss inside the previous day’s box range.
- Keep risk proportional to the measured daily volatility.
Take Profit
- Target a portion of the current day’s average volatility.
- Alternatively, trail profits as long as price remains outside the box.
Candles Box Daily Market Session + Trend Predictor v1.0 Forex Strategy for MT4
This strategy combines two powerful tools: the Candles Box Daily Market Session Forex Indicator and the Trend Predictor v1.0 Forex Indicator for MT4.
The Candles Box indicator paints each daily session as a colored box — green if the day closed higher, crimson if it closed lower.
The Trend Predictor prints arrows: blue for buy and red for sell.
Together, these indicators offer traders a simple yet effective way to align intraday entries with the dominant daily trend.
The approach works on all timeframes, but is most effective on the M15, M30, and H1 charts.
The idea is to trade only in the direction of the most recent daily box color and use the Trend Predictor’s arrows for precise entry timing.
Buy Entry Rules
- Wait for the current daily Candles Box to be green, indicating that the overall sentiment is bullish.
- Look for a blue arrow from the Trend Predictor v1.0 indicator signaling a buy opportunity.
- Enter a buy trade at the open of the next candle after the blue arrow appears.
- Place your stop loss below the recent swing low or below the lower boundary of the daily green box.
- Take profit can be set at a 1.5:1 or 2:1 reward-to-risk ratio, or when a red arrow appears, indicating potential trend change.
Sell Entry Rules
- Wait for the current daily Candles Box to be crimson, showing a bearish market close.
- Watch for a red arrow from the Trend Predictor v1.0 indicator confirming a sell signal.
- Enter a sell trade at the open of the next candle following the red arrow.
- Set your stop loss above the recent swing high or above the upper boundary of the crimson box.
- Take profit at a 1.5:1 or 2:1 reward-to-risk ratio, or when a blue arrow appears, suggesting a reversal.
Advantages
- Combines daily trend bias with intraday signal timing, reducing false trades.
- Visually intuitive — color boxes and arrows make setups easy to spot.
- Works across major pairs and timeframes, especially during trending market conditions.
- Encourages discipline by trading only in the direction of the higher timeframe bias.
- Clear entry and exit rules make it suitable for both beginners and experienced traders.
Drawbacks
- Trend Predictor arrows can repaint or lag in volatile conditions.
- Best used during active market sessions like London and New York for higher momentum.
- Stop loss placement may need adjustment for pairs with higher volatility, like GBPJPY or XAUUSD.
Example Case Study 1 – EURUSD H1
On EURUSD, the previous day closed bullish, forming a green Candle Box.
The Trend Predictor printed a blue arrow at 1.0860 during the London session.
A buy order was placed at 1.0862 with a stop loss at 1.0840 (22 pips) and a take profit at 1.0904 (42 pips).
The pair rallied steadily, reaching the target before the New York close, showing how aligning with the green box trend increased the probability of success.
Example Case Study 2 – GBPUSD M30
On GBPUSD, the daily box turned crimson after a bearish close.
The next day, during early London hours, a red arrow appeared at 1.2795.
A sell was placed at 1.2794 with a stop loss at 1.2810 (16 pips) and a target at 1.2760 (34 pips).
The market dropped sharply, hitting the target within two hours, confirming how following the crimson box trend gives strong short setups.
Strategy Tips
- Always confirm that the current daily box matches the direction of your trade — green for buy, crimson for sell.
- Avoid trading near major economic news releases to reduce whipsaws.
- Combine this system with support/resistance or moving averages for added confirmation.
- Use it during London and New York sessions when volatility supports cleaner moves.
- Keep a trade log to review how well daily trend alignment improves your win rate over time.
Download Now
Download the “candles-box-session-indicator.ex4” Metatrader 4 indicator
FAQ
What does the colored box represent?
The box represents the previous day’s trading range and closing direction, giving insight into daily market bias.
How is daily volatility calculated?
Volatility is measured in pips based on the full price range of the trading day.
Is this indicator only for breakout trading?
No. While it works well for breakouts, it can also be used to assess daily bias and session conditions.
Can it be customized?
Yes. Traders can adjust colors, box visibility, and information panel settings to suit their chart layout.
Summary
The Candles Box Daily Market Session indicator for MT4 provides a clear view of daily market direction and volatility.
Its visual box layout simplifies session analysis and breakout planning.
The indicator is flexible and easy to customize for different strategies.
It helps traders stay aligned with daily market conditions and volatility expectations.


