
About the RSI vs Bollinger Bands Indicator
The RSI vs Bollinger Bands indicator for MT4 is a breakout-focused trading tool that combines Bollinger Band behavior with RSI momentum analysis.
It detects when price pushes beyond its normal range and confirms the move using RSI strength.
When a valid breakout forms, the indicator draws arrows directly on the price area, making trade opportunities easy to spot without additional interpretation.
Blue arrows signal bullish breakouts, while red arrows indicate bearish breakout pressure.
This indicator is designed to filter weak breakouts by requiring confirmation from both volatility expansion and momentum.
As a result, traders can focus on moves with stronger follow-through potential.
With multiple adjustable settings, the RSI vs Bollinger Bands indicator can be fine-tuned for different pairs, timeframes, and volatility conditions.
Free Download
Download the “RSI_vs_BB.mq4” MT4 indicator
Key Features
- Combines Bollinger Bands and RSI into a single signal system.
- Detects breakout conditions using volatility expansion.
- Draws buy and sell arrows directly on the price area.
- Offers extensive customization through input settings.
- Works on all currency pairs and timeframes.
Indicator Chart
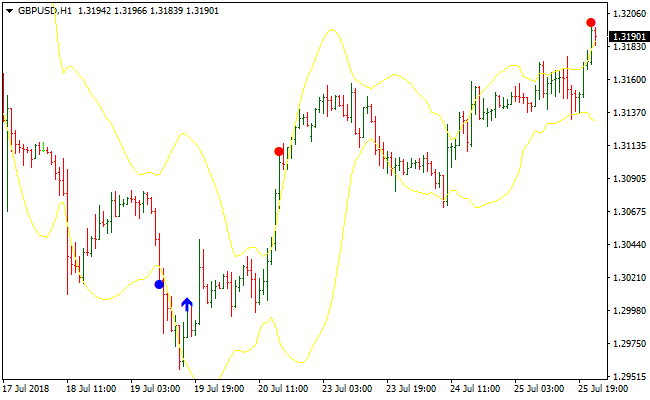
The RSI vs Bollinger Bands indicator appears beneath the main price area and plots blue and red arrows when breakout conditions are met.
The arrows highlight moments when price exits the Bollinger Band range with RSI confirmation, helping traders act quickly during momentum shifts.
Guide to Trade with RSI vs Bollinger Bands Indicator
Buy Rules
- Wait for a blue arrow to appear on the price area.
- Confirm price has pushed beyond the upper Bollinger Band.
- Ensure RSI supports bullish momentum.
- Open a buy trade at the close of the signal candle.
Sell Rules
- Wait for a red arrow to appear on the price area.
- Confirm price has pushed beyond the lower Bollinger Band.
- Ensure RSI supports bearish momentum.
- Open a sell trade at the close of the signal candle.
Stop Loss
- Place the stop below a nearby support zone for buy trades.
- Place the stop above a nearby resistance zone for sell trades.
- Adjust placement if volatility expands after the breakout.
Take Profit
- Take partial profits after strong impulsive moves.
- Exit fully if an opposite arrow appears.
RSI vs Bollinger Bands and Cycle Identifier Signals Forex Strategy MT4
This MT4 forex strategy combines the trend clarity from the RSI vs Bollinger Bands Indicator with the timing precision of the Cycle Identifier Signals Indicator.
The first indicator lets you identify the direction of the market by reading the trend slope and relative volatility.
When the trend is upsloping, the bias is bullish, and when it is downward sloping, the bias is bearish.
The Cycle Identifier adds signal bars that appear as green below the zero level for buy signals and red above the zero level for sell signals, helping confirm entry timing within those trends.
This strategy is ideal for traders who want to enter in the direction of dominant price movement while using cycles to fine-tune entries.
It works well on M15, M30, and H1 timeframes where trend moves and cycle swings are more defined.
Major currency pairs such as EURUSD, GBPUSD, and USDCHF often produce clearer setups with this method during active session hours.
Buy Entry Rules
- The RSI vs Bollinger Bands indicator must show an upsloping trend, indicating bullish bias.
- A green cycle bar must appear below the zero level, signaling buy momentum.
- Enter a buy trade at the close of the candle with the green cycle bar once price respects recent support.
- Place the stop loss below the nearest swing low or below recent Bollinger Band support.
- Set take profit at a preselected pip target or at the next resistance level from a higher timeframe.
Sell Entry Rules
- The RSI vs Bollinger Bands indicator must show a downward sloping trend, indicating bearish bias.
- A red cycle bar must appear above the zero level, signaling sell momentum.
- Enter a sell trade at the close of the candle with the red cycle bar once price respects recent resistance.
- Place the stop loss above the nearest swing high or above recent Bollinger Band resistance.
- Set take profit at a preselected pip target or at the next support level from a higher timeframe.
Advantages
- Combines clear trend direction with precise cycle timing for better entry quality.
- Green and red cycle bars give obvious entry cues without guesswork.
- Helps avoid countertrend trades by only taking setups that align with the trend slope.
- Works on multiple forex pairs and common day trading timeframes.
Drawbacks
- In choppy or low volatility markets, cycle signals can be frequent and less reliable.
- Trend slope may flatten before you get a cycle confirmation, leading to fewer setups.
- Slippage and spread expansion during news events can reduce profit potential.
- Requires practice to read the trend slope accurately and wait for quality cycle confirmations.
- May underperform during extended sideways ranges where neither trend nor cycles align cleanly.
Case Study 1
On EURUSD M30 during the European session, the RSI vs Bollinger Bands indicator showed a clear upsloping trend, indicating that bullish momentum was dominant.
After a small pullback into support, a green cycle bar formed below zero, signaling a buy opportunity.
A buy trade was entered at the close of the confirmation candle.
Price continued upward for a 22-pip move before reaching a preselected resistance target, resulting in a profitable setup.
The stop loss remained below the recent swing low for controlled risk.
Case Study 2
On GBPUSD H1 during the London to New York overlap, the trend displayed by the RSI vs Bollinger Bands indicator turned downward.
After a mild retracement toward resistance, a red cycle bar appeared above zero, signaling a sell entry.
A sell trade was taken on the close of that candle.
Price extended lower for 18 pips before hitting a support zone identified on a higher timeframe.
The stop loss was placed above the recent swing high to protect the trade in case of a reversal.
Strategy Tips
- Only take buy signals when the trend is clearly upsloping and sell signals when it is clearly downward sloping.
- Wait for cycle bars to appear at natural support or resistance areas for higher probability entries.
- Avoid trading during major economic releases to reduce the risk of fake signals and whipsaws.
- Use higher timeframe swing levels to inform your take profit targets and trailing stop adjustments.
- Keep consistent risk per trade to manage your equity and avoid large drawdowns.
- If the trend slope and cycle signals conflict, stay out until both align to reduce low-quality entries.
Download Now
Download the “RSI_vs_BB.mq4” Metatrader 4 indicator
FAQ
What type of market suits this indicator best?
It performs best during volatile conditions when price expands beyond its usual range and momentum follows through.
Can this indicator be used for scalping?
Yes. By adjusting Bollinger Band and RSI settings, it can be tuned for lower timeframes and faster breakout trades.
Is RSI confirmation mandatory for signals?
Yes. RSI is part of the core logic and helps filter out weak or false Bollinger Band breakouts.
Summary
The RSI vs Bollinger Bands indicator provides a focused approach to breakout trading by combining volatility expansion with momentum confirmation.
Its arrow-based signals simplify decision-making during fast market moves.
With flexible settings and clear visual signals, this indicator fits traders who prefer breakout strategies and want confirmation beyond basic Bollinger Band touches.


