
About the VROC Indicator
VROC, short for Volume Rate of Change, is a Forex indicator developed for MetaTrader 4 that focuses on measuring how fast trading volume is increasing or decreasing.
The VROC indicator appears as a green line that reacts to changes in volume acceleration.
When the line rises sharply, it signals a surge in market participation.
When it slows down or turns lower, it may suggest fading interest from traders.
These shifts often occur before noticeable price movement, making VROC useful for early trade planning.
VROC can be applied to any currency pair and timeframe, from short-term scalping charts to long-term swing trading setups.
It works best as a supporting indicator, helping traders confirm breakouts, trend continuation, or potential reversals based on volume behavior.
Free Download
Download the “VROC.mq4” indicator for MT4
Key Features
- Measures volume acceleration rather than raw volume.
- Displays data in a separate MT4 indicator window.
- Helps identify early momentum shifts.
- Compatible with all currency pairs and timeframes.
- Supports breakout, trend, and reversal strategies.
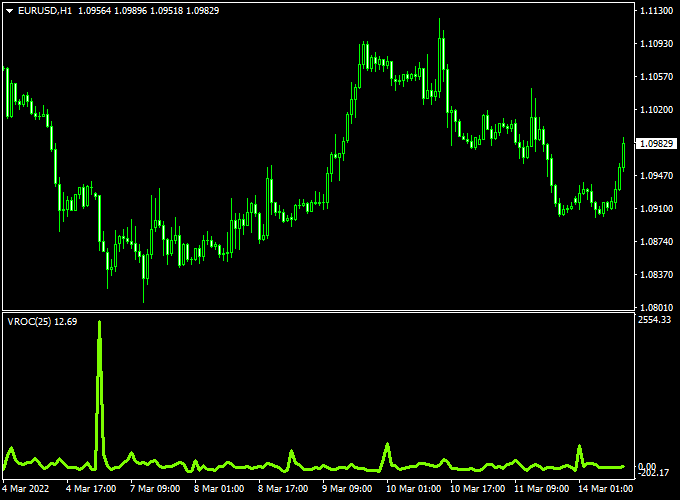
Indicator Chart
The chart below shows the VROC indicator applied beneath a Forex price chart.
The green line highlights changes in volume speed, rising during periods of increased activity.
Sharp movements in the line often align with strong price moves or upcoming volatility expansions.
Guide to Trade with VROC
Buy Rules
- Wait for the VROC line to rise sharply above its recent average.
- Confirm price is breaking above consolidation or resistance.
- Enter a buy trade after bullish price confirmation.
Sell Rules
- Wait for a strong upward spike in VROC during a bearish price setup.
- Confirm price is rejecting resistance or breaking support.
- Enter a sell trade after bearish price confirmation.
Stop Loss
- Place a stop loss below the recent price structure for buy trades.
- Place a stop loss above the recent price structure for sell trades.
Take Profit
- Target areas where VROC begins to flatten or decline.
- Scale out profits as volume acceleration slows.
- Use higher timeframe support or resistance as exit targets.
VROC + Golden Super K MT4 Forex Strategy
This trading strategy combines the VROC Forex Indicator for MT4 with the Golden Super K Forex Trend Indicator for MT4.
It focuses on identifying high-probability trade setups by analyzing both price momentum and volume activity.
This approach works well for traders who want to catch strong intraday moves on pairs such as EUR/USD, GBP/JPY, and USD/CHF.
The Volume Rate of Change (VROC) helps you detect surges in trading activity that often happen before major breakouts.
When volume suddenly increases, it usually means institutional traders are taking positions.
The Golden Super K confirms those volume-based entries by showing clear directional trends.
Together, these indicators create a practical day trading or swing trading system suitable for M15, M30, and H1 charts.
Buy Entry Rules
- Wait for the VROC line to rise sharply, signaling an increase in market activity.
- Confirm that the Golden Super K line turns blue, showing a bullish trend.
- Open a buy trade at the close of the confirmation candle.
- Set a stop loss below the previous swing low or 20 pips below entry (whichever is larger).
- Take profit at the next resistance level or when the Golden Super K line starts flattening.
Sell Entry Rules
- Wait for the VROC line to spike, showing an increase in bearish volume pressure.
- Confirm that the Golden Super K line turns orange, signaling a downtrend.
- Enter a sell trade when the candle closes below the recent consolidation area.
- Set a stop loss above the previous swing high or 20 pips above the entry.
- Take profit near the next support area or when the Golden Super K line starts turning flat.
Advantages
- Combines volume and trend confirmation for higher accuracy.
- Simple and effective entry logic suitable for all skill levels.
- Filters out false breakouts by waiting for both volume and trend alignment.
- Works well across multiple timeframes.
Drawbacks
- Can miss early moves during sudden market reversals.
- VROC may produce false volume spikes in low-liquidity sessions.
- Requires patience for both indicators to align before entry.
Case Study 1 – EUR/USD (M30 Chart)
On the EUR/USD M30 chart, the VROC line spiked sharply around the London session open, hinting at rising volume.
A few candles later, the Golden Super K turned blue, confirming a bullish trend.
A buy trade at 1.0845 with a 25-pip stop loss reached 1.0890 within three hours for a 45-pip gain.
This setup combined early volume confirmation with strong price follow-through.
Case Study 2 – GBP/JPY (H1 Chart)
On the GBP/JPY hourly chart, a sudden drop in volume was followed by a large VROC surge, signaling renewed market interest.
When the Golden Super K turned orange, a sell trade was opened at 186.75 with a 30-pip stop.
The trade closed at 186.05 for a 70-pip profit as bearish momentum extended during the Asian session.
The combination effectively captured the short-term trend reversal.
Strategy Tips
- Focus on major pairs with higher volatility, as volume spikes are more meaningful.
- Avoid trading during low-volume periods like late Friday sessions.
- Always confirm both indicators before entering trades to minimize false signals.
- Use trailing stops to lock in profits during strong volume-driven moves.
- Backtest the strategy across different pairs to find which responds best to volume changes.
Download Now
Download the “VROC.mq4” indicator for Metatrader 4
FAQ
What makes VROC different from standard volume indicators?
VROC measures the speed of volume change rather than absolute volume levels.
This allows traders to detect sudden increases or decreases in participation earlier.
Can VROC predict breakouts?
Strong VROC spikes often appear before or during breakouts.
When combined with price compression, it can help anticipate volatility expansion.
Is VROC suitable for lower timeframes?
Yes, VROC works well on lower timeframes.
However, signals can be more frequent, so confirmation from price action is advised.
Should VROC be used alone?
VROC provides valuable volume insight but performs best when paired with trend or support and resistance analysis.
It is designed to confirm, not replace, price-based decisions.
Summary
The VROC Forex indicator offers traders a deeper view into market activity by focusing on volume acceleration.
Its green line highlights moments when trading interest increases or fades, often before price reacts.
This makes it a useful tool for timing entries and exits more effectively.
VROC is flexible, easy to apply, and compatible with all trading styles.
With added alerts or smoothing options, its usability could be further enhanced.
For traders who rely on volume confirmation to support their strategies, VROC delivers valuable market insight.


