About the SDX Zone Breakout Forex Indicator
The SDX Zone Breakout Forex indicator for MT4 is a practical solution for traders who want to capitalize on sudden bursts of volatility.
Instead of manually drawing dozens of support and resistance lines, this system identifies the most relevant zones for you automatically.
The SDX Zone Breakout Forex indicator for MT4 provides interesting zones on the chart that can be used to trade price level breakouts with high precision.
It simplifies the chart by focusing on where the market is actually trapped.
The indicator consists of several buy and sell breakout lines, but the most important ones are the upper and lower yellow lines.
These yellow markers act as the ultimate boundaries for the current trading range.
When price escapes these levels, it often signals the start of a fresh trend.
Free Download
Download the “SDX-ZoneBreakout.mq4” indicator for MT4
Key Features
- It automatically calculates and plots significant horizontal breakout levels on any chart.
- The indicator uses a color-coded system with yellow lines representing the primary breakout zones.
- The tool helps traders avoid the “noise” found inside a consolidation range.
Indicator Chart
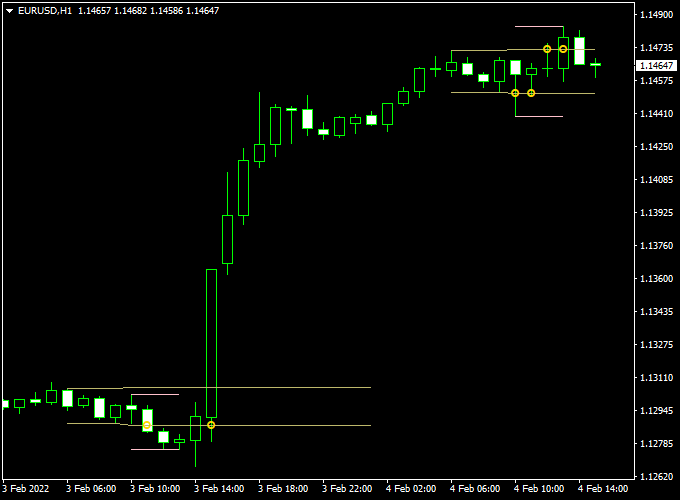
The SDX Zone Breakout indicator chart displays several horizontal lines overlaid on the price candles.
The most prominent features are the upper and lower yellow lines which define the active trading zone.
When a candle manages to close outside of these yellow lines, it highlights a potential shift in market control.
By looking at the distance between the lines, you can also judge the current volatility of the currency pair.

Guide to Trade with SDX Zone Breakout Forex Indicator
Trading with this tool is about waiting for the price to commit to a direction beyond the established yellow boundaries.
Buy Rules
- Monitor the chart and identify the position of the upper yellow breakout line.
- Open a buy trade when the price closes above the upper yellow breakout level line.
- Ensure the breakout candle is strong and not just a small wick touching the level.
- Check that there is no immediate major resistance just above your entry point.
Sell Rules
- Locate the lower yellow breakout line on your current timeframe.
- Open a sell trade when the price closes below the lower yellow breakout level line.
- Verify the signal by waiting for a full candle close to confirm the breakout.
- Confirm that the overall market sentiment is bearish to increase the trade’s probability.
Stop Loss
- For buy trades, place your stop loss just below the breakout candle or the lower yellow line.
- For sell trades, position the stop loss above the breakout candle or the upper yellow line.
- Always keep your risk fixed per trade to ensure long-term account safety.
Take Profit
- Exit the trade at the next major horizontal level or a previous swing high/low.
- You can also use a fixed risk-to-reward ratio of 1:2 to maintain a positive expectancy.
- Another option is to trail your stop loss behind the price as it moves in your favor.
SDX Zone Breakout + Flat Trend RSI Indicator Forex Day Trading Strategy
This MT4 day trading strategy combines the SDX Zone Breakout Forex Indicator with the Flat Trend RSI Indicator for Forex.
It is designed for intraday traders looking to capture strong price moves following breakout levels while confirming the overall trend.
The strategy works best on M15 to H1 charts and is suitable for major currency pairs like EUR/USD, GBP/USD, USD/JPY, and AUD/USD.
The SDX Zone Breakout Indicator identifies key breakout levels using upper and lower yellow lines.
A close above the upper line signals a potential bullish breakout, while a close below the lower line signals a bearish breakout.
The Flat Trend RSI shows trend direction via a histogram: blue indicates an uptrend, red indicates a downtrend.
Trading only when the breakout and trend align helps improve accuracy and reduce false signals.
Buy Entry Rules
- Wait for the price to close above the upper yellow breakout line on the SDX Zone Breakout indicator.
- Confirm the trend with the Flat Trend RSI histogram showing blue bars.
- Enter a buy trade at the next candle after confirmation.
- Set a stop loss below the breakout line or recent swing low.
- Take profit at 30–50 pips for M15, or exit when the histogram turns red, indicating trend reversal.
Sell Entry Rules
- Wait for the price to close below the lower yellow breakout line on the SDX Zone Breakout indicator.
- Confirm the trend with the Flat Trend RSI histogram showing red bars.
- Enter a sell trade at the next candle after confirmation.
- Set a stop loss above the breakout line or recent swing high.
- Take profit at 30–50 pips for M15, or exit when the histogram turns blue.
Advantages
- Combines breakout timing with trend confirmation for higher-probability trades.
- Works on multiple currency pairs and intraday timeframes.
- Reduces false breakouts by confirming trend direction.
- Ideal for day traders seeking structured setups with defined risk.
Drawbacks
- Less effective in low-volatility markets where breakouts are rare.
- Requires monitoring during active trading hours for optimal entries.
- False breakouts may still occur if trend confirmation is ignored.
- Profit targets may need adjustment for highly volatile sessions.
- Stop losses can be hit quickly if the breakout fails, so risk management is essential.
Example Case Study 1: EUR/USD M15 Chart
EUR/USD closed above the upper yellow breakout line at 1.0965, while the Flat Trend RSI histogram was blue.
A buy trade was entered at 1.0966 with a stop loss at 1.0948 and a take profit at 1.1000 (34 pips).
The trade reached the target in under an hour during the London session, confirming the trend-following breakout strategy works well in volatile conditions.
Example Case Study 2: GBP/USD M30 Chart
GBP/USD closed below the lower yellow breakout line at 1.2780, with the Flat Trend RSI histogram showing red.
A sell position was opened at 1.2779, stop loss at 1.2795, and take profit at 1.2730 (49 pips).
The trade completed within two hours during the New York session, demonstrating how trend confirmation combined with breakout timing helps catch intraday moves.
Strategy Tips
- Trade primarily during the London and New York sessions for better volatility and cleaner breakouts.
- Focus on major currency pairs for tighter spreads and more reliable breakouts.
- Wait for the candle to close beyond breakout lines to reduce false signals.
- Use stop losses and take profits according to the timeframe and volatility.
- Monitor the Flat Trend RSI histogram for trend changes to exit trades early if needed.
- Avoid trading during news events with unpredictable spikes unless experienced with fast scalping.
Download Now
Download the “SDX-ZoneBreakout.mq4” indicator for Metatrader 4
FAQ
What makes the yellow lines more important than the other lines?
While the indicator draws several levels, the yellow lines represent the outer boundaries of the most recent significant price consolidation.
Breaking these lines suggests that the market has enough momentum to start a new trend.
The other lines often represent minor intraday levels that are better used for taking partial profits rather than entering new positions.
Can I use this indicator for scalping on M5 charts?
Yes, the SDX Zone Breakout is very popular with scalpers on the 5-minute and 15-minute timeframes.
It helps you find the “breakout of the range” during the London or New York sessions.
Just be mindful of the spread, as breakout trades on very low timeframes require precise execution and a fast broker.
Does this indicator work best in a ranging or trending market?
This tool is specifically designed to identify the transition from a ranging market to a trending one.
It is most effective when the market has been sideways for a while and the yellow lines are relatively close together.
This “squeeze” often leads to a powerful breakout that you can catch using the yellow line signals.
Summary
The SDX Zone Breakout for MT4 is an effective technical tool that assists in determining the appropriate timing for market entries.
By focusing on confirmed price closes outside of established zones, it helps you avoid the common mistake of buying at the top or selling at the bottom of a range.
This tool helps traders maintain a disciplined routine by highlighting levels where the market is statistically likely to expand.
Using this indicator allows you to filter high-risk trades that occur within the middle of a choppy consolidation.
This tool is perfect for those who want to spend less time analyzing and more time executing trades based on objective price levels.


