About the Brooky OBTR Forex Signals Indicator
The Brooky OBTR Forex Signals Indicator is an oscillator-based trading tool created for MetaTrader 4 traders who prefer clean charts and straightforward signals.
It is designed to highlight short-term momentum shifts and provide actionable buy and sell opportunities without overcomplicating the trading process.
The indicator is displayed in a separate sub-window below the main price chart.
It plots a colored signal line that changes based on market direction.
A green line reflects bullish pressure, while a red line signals bearish momentum.
This layout allows traders to monitor entries without distracting from price action.
It works well as a standalone signal tool or as an additional confirmation layer alongside existing strategies.
The indicator adapts to all currency pairs and timeframes, offering flexibility for different trading styles.
Free Download
Download the “OBTR.mq4” indicator for MT4
Key Features
- Oscillator-based buy and sell signal indicator.
- Green signal line for bullish conditions.
- Red signal line for bearish conditions.
- Displayed in a clean bottom chart window.
- Suitable for scalping and day trading.
- Can be combined with other trading systems.
Indicator Chart
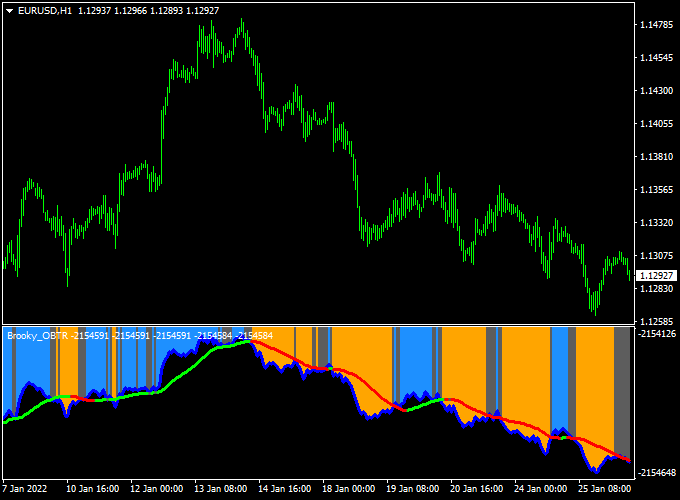
The chart shows the Brooky OBTR Forex Signals Indicator plotted in a separate MT4 sub-window.
The colored signal line responds to momentum changes in price action.
When the line turns green, it reflects increasing buying strength. When it turns red, it signals growing selling pressure.
Traders use these shifts to time entries in line with short-term market direction.

Guide to Trade with Brooky OBTR Forex Signals Indicator
Buy Rules
- Wait for the signal line to turn green in the oscillator window.
- Confirm that price action supports upward movement.
- Focus on signals forming during active trading hours.
- Enter a buy trade once momentum is established.
Sell Rules
- Wait for the signal line to turn red in the oscillator window.
- Check that price action favors bearish continuation.
- Avoid signals during low-volatility periods.
- Enter a sell trade after the signal stabilizes.
Stop Loss
- Place the stop loss beyond recent swing levels.
- Allow sufficient space for short-term market noise.
- Keep overall exposure within predefined limits.
Take Profit
- Target nearby intraday support or resistance zones.
- Close trades when the signal line changes color.
- Lock in profits during strong momentum bursts.
- Avoid holding positions after momentum fades.
Brooky OBTR & SuperTrend MTF Forex Day Trading Strategy
This day‑trading strategy for MT4 combines the Brooky OBTR Forex Signals Indicator and the SuperTrend MTF Forex Signal Indicator.
The OBTR indicator uses a green signal line for buy opportunities and a red signal line for sell opportunities.
The SuperTrend MTF provides trend‑direction clarity via green lines for bullish trends and red lines for bearish trends.
When both indicators align, you enter a trade in the direction of the trend and the signal line.
This method is designed for major pairs like EUR/USD, GBP/USD, USD/JPY, and works on time frames such as M15 or H1 for day trading.
Buy Entry Rules
- Check that the SuperTrend MTF line is green, indicating a bullish trend.
- The OBTR indicator’s signal line turns green, signaling a buy opportunity.
- Enter a buy trade as soon as both conditions are confirmed.
- Place a stop loss a few pips below the most recent swing low or just under a recent OBTR signal low.
- Set take profit at a reasonable intraday target (for example, 20‑50 pips) or exit when the SuperTrend line turns red or OBTR turns red.
Sell Entry Rules
- Confirm the SuperTrend MTF line is red, showing a bearish trend.
- The OBTR signal line turns red, indicating a sell opportunity.
- Enter a sell trade once both conditions align.
- Place a stop loss a few pips above the most recent swing high or just above the recent OBTR signal high.
- Take profit around 20‑50 pips (depending on pair and session) or exit when SuperTrend flips green or OBTR flips green.
Advantages
- Combines trend confirmation (SuperTrend) with a dedicated signal line (OBTR) — reducing ambiguous entries.
- Logical stop‑loss placement based on recent structure and signal line helps with risk control.
- Day trading focus means you don’t hold trades overnight, and you can catch intraday swings on major pairs.
- Clear visual cues make it easier to monitor multiple charts and act when conditions align.
Drawbacks
- In ranging or low‑volatility markets, the SuperTrend line may flip often, and OBTR signals may generate false entries.
- Targets of 20‑50 pips may be modest in larger trending moves, which could reduce potential reward if you exit early.
- Because trades depend on two signals aligning, you may miss some opportunities when one indicator lags.
- You must pay attention throughout the day; this is not a set‑and‑forget approach and is somewhat time‑intensive.
- Spread and slippage during high‑impact news events may hurt profit potential or cause early stop‑outs.
Case Study 1 – EUR/USD H1 Chart
On the EUR/USD H1 chart during the London‑New York overlap, the SuperTrend MTF line turned green at 1.0800, indicating a bullish trend.
Shortly after, the OBTR signal line turned green at 1.0805.
A buy trade was entered at 1.0805 with a stop loss at 1.0778 (22 pips) and a target of 1.0850 (45 pips).
The price moved up steadily in line with the trend and reached the target in a few hours.
Case Study 2 – GBP/USD M15 Chart
On GBP/USD during the New York session, the SuperTrend line flipped red at 1.3720, showing a bearish trend.
The OBTR signal line turned red at 1.3715 shortly after.
A sell trade was entered at 1.3715 with a stop loss at 1.3742 (27 pips) and a take profit target of 1.3670 (45 pips).
The pair dropped steadily and exited profitably as trend continuation confirmed the move.
Strategy Tips
- Focus on major currency pairs such as EUR/USD, GBP/USD, USD/JPY, and AUD/USD for better liquidity and tighter spreads.
- Prefer trading during active sessions (London and New York) when intraday moves are stronger and trends are easier to follow.
- If the SuperTrend line is flat or repeatedly flipping, consider skipping signals — the market may be range‑bound.
- Avoid entering new trades just before major economic announcements, as trend direction may shift rapidly and false signals may occur.
Download Now
Download the “OBTR.mq4” indicator for Metatrader 4
FAQ
What makes the Brooky OBTR indicator different from arrow-based systems?
Instead of arrows, it uses a momentum-driven signal line, allowing traders to follow strength and weakness more fluidly.
Is the indicator suitable for fast trading styles?
Yes, it is well-suited for scalping and short-term trades, especially during high-liquidity sessions.
Can the indicator be used as a confirmation tool?
Many traders use it alongside price action or trend indicators to validate entry timing.
Which trading sessions are recommended?
The London and New York sessions tend to produce the most reliable signals due to increased volatility.
Summary
The Brooky OBTR Forex Signals Indicator for MT4 offers a clean and efficient way to trade short-term momentum using an oscillator-based approach.
Its color-changing signal line simplifies decision-making while keeping charts uncluttered.
With strong performance during active market sessions, flexible use as a standalone or supporting tool, and lightweight execution, the indicator fits well into both scalping and day trading workflows.
When combined with disciplined trade management, it can enhance timing and consistency.


