About the Monster Oscillator Indicator
The Monster Oscillator indicator for Metatrader 4 is a buy and sell trading signals tool designed to follow the overall market trend.
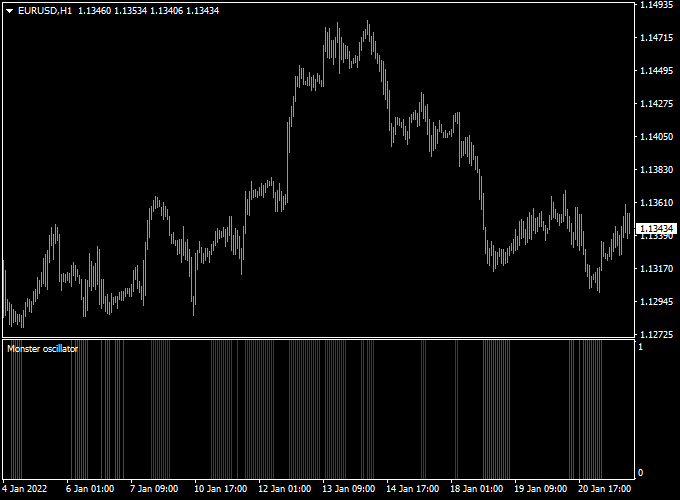
The indicator appears in a separate MT4 sub-window as a histogram.
Green bars represent bullish momentum, while red bars indicate bearish pressure.
Between these bars, black spaces appear, signaling a pause in momentum or a range-bound market.
This visual behavior allows traders to stay aligned with the dominant trend while avoiding low-quality setups.
Free Download
Download the “Monster oscillator.mq4” indicator for MT4
Key Features
- Displays clear buy and sell signals using color-coded histogram bars.
- Follows the overall market trend rather than short-term noise.
- Shows range-bound conditions using black histogram gaps.
- Works well for both trade entries and exits.
Indicator Chart
The Monster Oscillator indicator chart is displayed in a separate window below the price chart.
It uses green and red histogram bars to reflect trend momentum.
Black spaces between bars indicate consolidation, helping traders manage open positions with patience and discipline.

Guide to Trade with the Monster Oscillator Indicator
Buy Rules
- Confirm the overall market bias using price action or trend analysis.
- Wait for the first green histogram bar to appear in the sub-chart window.
- Enter a buy trade at the opening of the next candle.
- Avoid entries if black spaces persist for several bars.
Sell Rules
- Confirm bearish conditions on the main chart.
- Wait for the first red histogram bar to appear in the sub-chart window.
- Enter a sell trade at the opening of the next candle.
- Skip trades during extended black histogram gaps.
Stop Loss
- Place the stop loss below the most recent support low for buy trades.
- Place the stop loss above the most recent resistance high for sell trades.
- Keep stops tight when trading lower timeframes.
- Exit early if the histogram flips color against your position.
Take Profit
- Set take profit at the next support or resistance level.
- Hold the trade as long as the histogram maintains its color.
- Close the trade when the histogram turns black or changes direction.
- Partial profits can be taken after strong consecutive bars.
Practical Tips
- Avoid trading during low-volatility sessions when black spaces dominate.
- Focus on the first histogram color change for higher-probability entries.
- Do not chase late signals after several consecutive bars.
Monster Oscillator Indicator + Best Forex Scalping Indicator MT4 Strategy
This scalping strategy brings together the Monster Oscillator Forex Indicator MT4 and the Best Forex Scalping Indicator MT4.
The first gives you a quick view of the dominant trend via histogram bars (green for bullish, red for bearish).
The second gives clear entry signals via arrows (blue arrow = buy signal, red arrow = sell signal).
Together, they aim to help you scalp small profits quickly during active market sessions.
This method is designed for very short time frames (1 minute to 15 minutes) on major currency pairs with good liquidity and tight spreads.
It suits scalpers who like to enter and exit quickly and who monitor trades actively.
Buy Entry Rules
- Wait for the Monster Oscillator histogram bars to turn green (indicating bullish trend momentum).
- Then look for a blue arrow from the Best Forex Scalping Indicator signaling a buy entry.
- Enter a buy after the blue arrow appears and the next candle closes above the high of the arrow candle (or simply confirms upward direction).
- Place a stop loss just below the recent low or below the swing low formed just before the entry (for example, 5-12 pips depending on pair and timeframe).
- Set a take profit target modestly (for example, 8-20 pips) or use a fixed risk-reward ratio like 1:1.5.
- Alternatively, consider closing if the histogram bars switch color (from green back to red) or you receive a sell arrow from the second indicator.
Sell Entry Rules
- Wait for the Monster Oscillator histogram bars to turn red (indicating bearish momentum).
- Then look for a red arrow from the Best Forex Scalping Indicator signaling a sell entry.
- Enter a sell after the red arrow appears and the next candle closes below the low of the arrow candle (or confirms downward direction).
- Place a stop loss just above the recent swing high or the high formed just before the entry (for example, 5-12 pips depending on pair and timeframe).
- Set a take profit target of around 8-20 pips or risk-reward of 1:1.5.
- You may also exit early if the histogram bars turn green or a buy arrow appears.
Advantages
- Simple and fast: the coloured histogram plus arrow signals make entries straightforward.
- Well-suited for scalping: short holding time, clear exit rules, and small pip targets reduce exposure to large adverse moves.
- Works on very short time frames and major pairs with good liquidity, so you can capture many small moves.
- Combines trend/momentum (via the Monster Oscillator) with a clear signal trigger (via the Best Forex Scalping Indicator) for added confirmation.
Drawbacks
- Because it is a scalping approach, you must trade actively and monitor every setup; it’s not a “set and forget” method.
- In choppy or sideways markets, the histogram may flip frequently, and arrow signals may generate false entries, so risk is higher in low-volatility periods.
- The strategy can produce many trades with small profits, so you must maintain a high win-rate or good risk-reward to make it worthwhile after spreads and commissions.
- Requires discipline to cut losses quickly; large moves against you in scalping can eat many small wins if not controlled properly.
Example Case Study 1 – EUR/USD (5-min Chart)
During the London session, EUR/USD’s Monster Oscillator bars turned green after a small pull-back.
Shortly afterward, the Best Forex Scalping Indicator gave a blue arrow at 1.1058.
A buy was entered at 1.1062. Stop loss was placed at 1.1045 (17 pips risk).
The take profit target was set at 1.1075 (13 pips target).
The histogram remained green during the move, and the trade was closed at the target within 10 minutes, netting +13 pips.
Example Case Study 2 – GBP/JPY (1-min Chart)
In a high-liquidity burst, GBP/JPY’s Monster Oscillator turned red, signaling bearish momentum.
The Best Forex Scalping Indicator produced a red arrow at 189.45.
A short sell was placed at 189.40. Stop loss was 189.57 (17 pips risk).
The target was set at 189.25 (15 pips).
The histogram bars stayed red, and the price moved quickly downward, closing the trade after 8 minutes at the target with +15 pips profit.
Strategy Tips
- Use pairs with tight spreads and good volume (EUR/USD, GBP/USD, USD/JPY, GBP/JPY) to maximize scalping efficiency.
- Avoid trading during major news releases or right before/after them because volatility and spikes can trigger false signals and widen spreads.
- Look for confirmations: even when the histogram turns color and an arrow appears, check that price action is clean (no huge rejection candles, not stuck in consolidation).
- Keep your lot size small relative to your account – since scalping uses small targets, you need consistent execution and low drawdown to stay profitable.
- Maintain a trading journal logging histogram color changes, arrow setups, stop/target levels, and outcomes.
Download Now
Download the “Monster oscillator.mq4” indicator for Metatrader 4
FAQ
What do the black spaces in the Monster Oscillator mean?
Black spaces indicate a lack of clear momentum. They usually appear during consolidation or ranging markets.
This helps traders avoid overtrading during low-quality conditions.
Which markets work best with the Monster Oscillator?
It performs best in trending forex pairs. Major and minor currency pairs tend to provide the most consistent signals.
Summary
The Monster Oscillator indicator for Metatrader 4 is a reliable and efficient trend-following tool.
It uses green and red histogram bars to highlight buy and sell opportunities while filtering out market noise.
The black spaces add an extra layer of decision support by identifying range-bound conditions.
Traders can apply it for entries, exits, or trade management across multiple timeframes.


