
About the Maloma Channel Forex Indicator
The Maloma Channel Forex Indicator for MetaTrader 4 is a trend-following tool that draws a dynamic price channel directly around candlesticks.
The channel is calculated using the Maloma trend method and adapts to changing market conditions.
It consists of two lines displayed in the main MT4 chart window.
The upper red channel line represents dynamic resistance, while the lower blue channel line acts as dynamic support.
Together, they help traders identify trend direction and potential reversal or continuation zones.
By combining channel direction with price interaction at the channel boundaries, it offers clear reference points for entries, exits, and trade management.
Free Download
Download the “Maloma channel.mq4” indicator for MT4
Key Features
- Draws an adaptive trend channel around the price
- The upper red line acts as dynamic resistance
- The lower blue line acts as dynamic support
- Displayed directly on the main MT4 chart
- Works on all timeframes and currency pairs
Indicator Chart
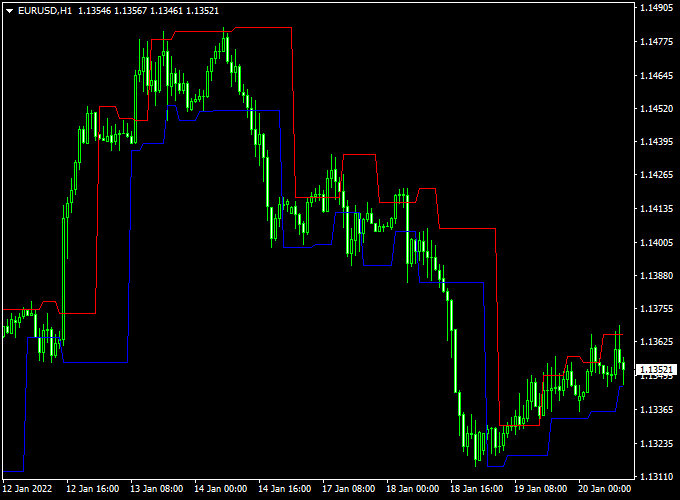
The chart below shows the Maloma Channel Forex Indicator applied to an MT4 chart.
Price moves within the channel while respecting the upper red resistance line and the lower blue support line.
Traders use these channel boundaries to identify pullbacks within trends and potential trade entry zones.
Guide to Trade with the Maloma Channel Forex Indicator
Buy Rules
- Confirm the Maloma channel is sloping upward
- Wait for the price to touch or slightly penetrate the lower blue channel line
- Open a buy trade after a bullish price reaction near the support line
Sell Rules
- Confirm the Maloma channel is sloping downward
- Wait for the price to touch or test the upper red channel line
- Open a sell trade after a bearish price reaction near resistance
Stop Loss
- Place the stop loss a few pips outside the channel boundary
- For buys, set the stop below the lower blue line
- For sells, set the stop above the upper red line
Take Profit
- Target the opposite side of the channel as the first objective
- Hold remaining positions while the price respects the channel direction
Practical Tips
- Trade only in the direction of the channel slope
- Avoid entries when the channel is flat or narrowing
- Combine with price action confirmation near channel edges
MT4 Maloma Channel and Xmaster Formula Forex Strategy
The MT4 Maloma Channel and Xmaster Formula Forex Strategy is a trend-following method that combines price channel structure with precise signal arrows.
It helps traders identify clear buy and sell zones with confidence and is suitable for both beginners and experienced traders.
The system works well on M15, H1, and H4 charts, where price movements are cleaner and more predictable.
The Maloma Channel Forex Indicator displays a dynamic price channel that automatically adjusts to market conditions.
When the channel is sloping upward, it signals a bullish market. When the channel slopes downward, it indicates a bearish environment.
The Xmaster Formula Forex Indicator complements it by printing arrows directly on the chart—upward arrows for buy signals and downward arrows for sell signals.
By combining the Maloma Channel’s trend direction with the Xmaster Formula’s entry alerts, traders can enter trades only when both indicators confirm the same direction.
This greatly reduces false signals and improves trade accuracy.
Buy Entry Rules
- Wait for the Maloma Channel to slope upward, showing a clear bullish trend.
- Look for an upward-pointing arrow from the Xmaster Formula indicator.
- Open a buy trade at the next candle after the arrow appears.
- Set a stop loss 20 to 30 pips below the lower Maloma Channel boundary.
- Take profit when the price approaches the upper channel line or after achieving a 1:2 risk-to-reward ratio.
Sell Entry Rules
- Wait for the Maloma Channel to slope downward, confirming a bearish trend.
- Look for a downward-pointing arrow from the Xmaster Formula indicator.
- Enter a sell position at the next candle after the arrow appears.
- Place a stop loss 20 to 30 pips above the upper Maloma Channel line.
- Take profit when the price nears the lower channel line or after reaching a 1:2 risk-to-reward ratio.
Advantages
- Combines trend direction with clear signal confirmation for higher accuracy.
- Works on multiple timeframes and pairs.
- Visually simple and easy to follow.
- Reduces emotional trading by waiting for both indicators to agree.
- Good risk-to-reward potential with well-defined targets.
Drawbacks
- May give fewer signals during sideways or ranging markets.
- False signals can occur in choppy conditions with flat channel slopes.
- Late entries are possible if the signal appears after a strong move has already started.
- Requires discipline to wait for full confirmation from both indicators.
Case Study 1: EUR/USD H1
On the EUR/USD H1 chart, the Maloma Channel turned upward, showing a new bullish phase.
A green upward arrow appeared from the Xmaster Formula at 1.0860, confirming the buy signal.
A trade was opened at 1.0862 with a stop loss at 1.0830.
The price moved smoothly within the channel and reached 1.0915, resulting in a gain of +53 pips.
The strategy effectively filtered noise and followed the channel direction for a strong profit.
Case Study 2: USD/JPY H4
On the USD/JPY H4 chart, the Maloma Channel started to slope downward.
Shortly after, a red downward arrow from the Xmaster Formula appeared at 151.40, signaling a sell opportunity.
A short trade was placed at 151.38 with a 35-pip stop loss above the channel.
Over the next 12 hours, the price dropped to 150.60, generating a +78 pip profit.
The combination of channel direction and arrow signal made it easy to identify the beginning of a trend shift.
Strategy Tips
- Use higher timeframes like H1 or H4 to filter out smaller market noise.
- Avoid trading when the Maloma Channel is flat, as this indicates a range.
- For added precision, trade only in the direction of the overall trend on a higher timeframe.
- Move the stop loss to breakeven once the price moves halfway to your target.
- Use the Xmaster arrows as confirmation only—never trade against the channel slope.
Download Now
Download the “Maloma channel.mq4” indicator for Metatrader 4
FAQ
How does the Maloma Channel determine trend direction?
Trend direction is defined by the slope of the channel itself.
An upward-sloping channel indicates bullish conditions, while a downward-sloping channel signals bearish conditions.
Should trades be taken when price breaks outside the channel?
The indicator is primarily designed for pullback trading within the channel.
Breaks outside the channel often signal trend exhaustion rather than continuation.
Can the channel width change during market volatility?
Yes. The channel adapts to price movement, expanding during higher volatility and tightening when market conditions are calmer.
Is the Maloma Channel better for intraday or swing trading?
It can be used for both, but many traders prefer it for intraday and swing setups where trends develop gradually and price respects channel boundaries.
Summary
The Maloma Channel Forex Indicator for MT4 provides traders with a practical trend-following framework built around dynamic channel behavior.
By highlighting support and resistance zones within a trend, it helps traders focus on higher-probability pullback entries.
Its adaptive channel lines respond to changing market conditions, making it useful across different instruments and timeframes.
When applied with proper trend filtering and disciplined risk management, the Maloma Channel can support consistent and methodical trading decisions.


