About the Magic Dots Forex Signal Indicator
The Magic Dots Forex Signal Indicator for MetaTrader 4 uses a trend-following logic to highlight potential market entries.
It simplifies trading by showing clear buy and sell dots directly on the chart.
Blue dots signal bullish trades, while red dots signal bearish trades.
Traders can use it as a standalone system or as a filter to enhance other strategies.
Free Download
Download the “Magic_dots_2_mtf_alerts.mq4” indicator for MT4
Key Features
- Displays buy and sell dots on the main MT4 chart
- Blue dots indicate buy signals
- Red dots indicate sell signals
- Can be used alone or alongside other indicators
- Helps identify trend continuation and potential reversals
Indicator Chart
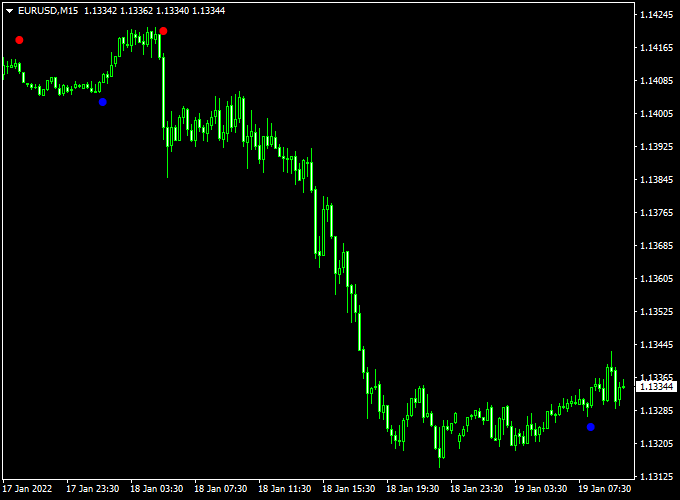
The chart below shows the Magic Dots Forex Signal Indicator in action.
Blue dots indicate potential bullish trades, while red dots indicate potential bearish trades.
Traders can use these signals to time entries and exits effectively.

Guide to Trade with Magic Dots Forex Signal Indicator
Buy Rules
- Enter a buy trade when a blue dot appears
- Hold the trade until a red dot signals a reversal
Sell Rules
- Enter a sell trade when a red dot appears
- Hold the trade until a blue dot signals a reversal
Stop Loss
- Place a stop loss a few pips below the recent swing low for buys
- Place a stop loss a few pips above the recent swing high for sells
- Use the last dot as a reference for dynamic stops
Take Profit
- Close trades when the opposite colored dot appears
- Use nearby support or resistance levels for partial or full exits
- Consider trailing the stop for longer trends
Practical Tips
- Use major and liquid currency pairs for clearer signals
- Place stop loss near recent swing highs or lows
- Use support and resistance levels to plan exits
- Monitor market volatility to adjust trade size
- Combine with other indicators for added confirmation
- Do not overtrade; follow signals selectively for higher accuracy
Scalping Strategy: Magic Dots Forex Signal & Ultimate Moving Average (MT4)
This scalping strategy combines the Magic Dots Forex Signal Indicator and the Ultimate Moving Average Indicator on MetaTrader 4 (MT4).
The Magic Dots indicator generates buy and sell signals using blue and red dots.
The Ultimate Moving Average confirms the trend: price above the MA indicates a bullish trend, and price below the MA indicates a bearish trend.
This strategy works best on M1 and M5 charts and is suitable for currency pairs such as EUR/USD, GBP/USD, and USD/JPY.
Buy Entry Rules
- Wait for a blue signal dot to appear on the Magic Dots indicator.
- Confirm that the price is above the Ultimate Moving Average, indicating a bullish trend.
- Enter a buy trade at the close of the bar where both conditions are met.
- Set a stop loss below the recent swing low or a fixed number of pips (e.g., 10-15 pips).
- Set a take profit at a risk-to-reward ratio of 1:1.5 or exit when a red dot appears or the price closes below the MA.
Sell Entry Rules
- Wait for a red signal dot to appear on the Magic Dots indicator.
- Confirm that the price is below the Ultimate Moving Average, indicating a bearish trend.
- Enter a sell trade at the close of the bar where both conditions are met.
- Set a stop loss above the recent swing high or a fixed number of pips (e.g., 10-15 pips).
- Set a take profit at a risk-to-reward ratio of 1:1.5 or exit when a blue dot appears or the price closes above the MA.
Advantages
- Combines immediate entry signals with trend confirmation for more reliable trades.
- Visual signals are clear and easy to interpret, ideal for fast-paced scalping.
- Works effectively on M1 and M5 charts for intraday trading.
- Suitable for highly liquid currency pairs.
Drawbacks
- Scalping on M1 and M5 charts can be stressful and requires constant attention.
- Price spikes or market noise may trigger false signals, leading to small losses.
- The strategy may underperform during low liquidity periods, such as off-market hours.
- High-frequency trading increases exposure to spreads and commission costs.
- Not suitable for traders who cannot monitor charts continuously.
Case Study 1: EUR/USD M1 Buy
On the EUR/USD M1 chart, a blue signal dot appeared on the Magic Dots indicator while the price was above the Ultimate Moving Average.
A buy position was entered at 1.1070.
Stop loss was set at 1.1060 (-10 pips) and take profit at 1.1085 (+15 pips).
The trade reached the take profit level, yielding +15 pips.
Case Study 2: GBP/USD M5 Sell
On the GBP/USD M5 chart, a red signal dot appeared on the Magic Dots indicator while the price was below the Ultimate Moving Average.
A sell position was entered at 1.2825. Stop loss was set at 1.2840 (+15 pips) and take profit at 1.2810 (-15 pips).
The trade reached the take profit level, resulting in +15 pips.
Strategy Tips
- Focus on M1 and M5 charts for quick scalping opportunities.
- Trade major currency pairs like EUR/USD, GBP/USD, and USD/JPY for tighter spreads and better liquidity.
- Confirm the trend direction using the Ultimate MA before entering trades.
- Wait for candle close confirmation to avoid false signals from sudden spikes.
- Apply strict risk management, limiting trades to 1-2% of account balance.
- Consider combining with support and resistance levels to improve trade accuracy.
- Use trailing stops to secure profits during rapid price movements.
Download Now
Download the “Magic_dots_2_mtf_alerts.mq4” indicator for Metatrader 4
FAQ
How do I read the signal dots?
Blue dots suggest a potential buy trade, while red dots suggest a potential sell trade. Always check the market context before entering.
Can this indicator catch early trend reversals?
Yes. The dots highlight momentum changes early, helping traders enter positions before larger moves occur.
How can I reduce false signals?
Combine dots with higher timeframe trends, support/resistance levels, or momentum indicators. Avoid trading during news spikes or low liquidity periods.
Summary
The Magic Dots Forex Signal Indicator for MT4 delivers clear buy and sell dots to highlight potential market entries.
Blue dots signal bullish trades, while red dots indicate bearish trades.
Traders can use this indicator alone or alongside other strategies to confirm signals.
When paired with proper risk management, trend analysis, and support/resistance levels, it helps traders make more confident and timely entries and exits.
The indicator provides a simple yet effective way to spot trend changes.


