About the Moving Average Trend Dashboard Indicator
The Moving Average Trend Dashboard is a free MT4 indicator that tracks market trends across multiple time frames.
It consolidates moving average signals into a dashboard, allowing traders to see buy and sell trends at a glance.
Blue arrows indicate bullish trends, while red arrows show bearish trends.
This makes it simple to follow the market direction without analyzing each time frame manually.
The indicator works as a trend-following system.
It calculates moving averages for each selected time frame and highlights the dominant trend using arrows in the dashboard.
Free Download
Download the “Ma trend.mq4” indicator for MT4
Key Features
- Displays a dashboard with buy and sell trends from multiple time frames.
- Blue arrows indicate bullish trends; red arrows indicate bearish trends.
- Provides a quick visual overview of market direction.
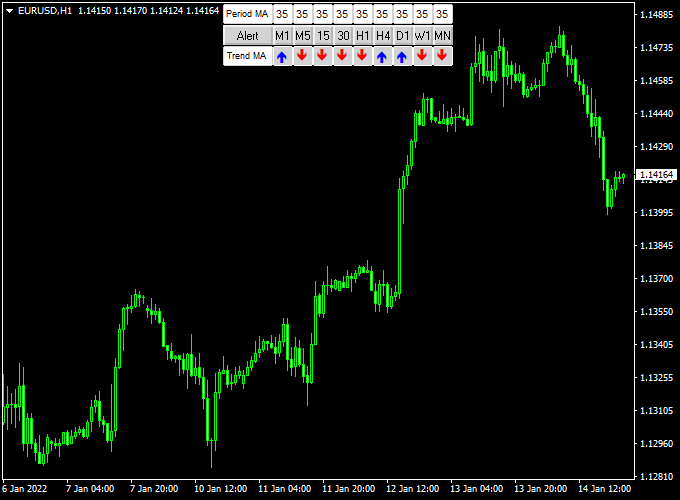
Indicator Chart
The chart shows the Moving Average Trend Dashboard with blue and red arrows representing the dominant trend across multiple time frames.
The dashboard provides a visual snapshot of market sentiment, making it easier to time entries and exits.
Traders can immediately see if most time frames support a buy or sell signal.

Guide to Trade with Moving Average Trend Dashboard
Buy Rules
- Open a buy trade when the majority of time frames display a blue buy arrow.
- Confirm the trend with price above the key moving averages if desired.
- Consider checking a higher time frame alignment for stronger confirmation.
Sell Rules
- Open a sell trade when the majority of time frames display a red sell arrow.
- Confirm the trend with price below the key moving averages if needed.
- Check higher time frames to ensure the overall market direction aligns.
Stop Loss
- For buy trades, place a stop loss below the nearest support level or the most recent swing low.
- For sell trades, place a stop loss above the nearest resistance level or the most recent swing high.
- Optionally, use ATR-based stops to account for market volatility.
Take Profit
- Close trades when the dashboard arrows reverse color (blue to red for buy, red to blue for sell).
- Alternatively, set take profit at key support/resistance zones highlighted on the chart.
- Use trailing stops to capture extended trends while locking in profits.
Practical Tips
- Focus on currency pairs with clear trends; avoid choppy markets.
- Wait for most time frames to align for stronger signals.
- Keep positions smaller during high volatility periods.
Moving Average Trend Dashboard + Waddah Attar Scalping Strategy for MT4
This scalping strategy combines the Moving Average Trend Dashboard Indicator for MT4 with the Waddah Attar Forex Scalping Indicator for MT4.
The setup uses multi-timeframe moving average alignment from the dashboard to confirm trend direction, and the Waddah Attar indicator to capture fast momentum entries.
Together, they help traders take precise scalping trades in the direction of the dominant trend while filtering out false signals.
The Moving Average Trend Dashboard shows blue arrows for bullish conditions and red arrows for bearish ones, from the 1-minute up to the monthly chart.
The Waddah Attar indicator generates green histograms for buy momentum and red histograms for sell momentum.
When both indicators align, traders can enter short-term scalps with confidence and controlled risk.
Why this combination works
The Moving Average Dashboard ensures you only trade in the direction of the dominant market trend.
The Waddah Attar indicator measures momentum strength, allowing traders to enter trades at the start of strong moves.
This combination aligns higher-timeframe bias with real-time momentum, a proven approach to achieving consistent scalping results even during volatile sessions.
Buy Entry Rules
- Check that the majority of arrows on the Moving Average Trend Dashboard are blue, showing a bullish trend across key timeframes such as M5, M15, and H1.
- Wait for the Waddah Attar histogram to turn green, confirming upward momentum.
- Enter a buy trade at the open of the next candle after both signals align.
- Place the stop loss 8 to 12 pips below the nearest swing low.
- Set a take profit target of 10 to 20 pips, depending on pair volatility.
- Exit early if the Waddah Attar histogram turns red or the dashboard shifts to red arrows.
Sell Entry Rules
- Check that most arrows on the Moving Average Trend Dashboard are red, showing a bearish bias across key timeframes.
- Wait for the Waddah Attar histogram to turn red, confirming downside momentum.
- Enter a sell trade at the open of the next candle after confirmation.
- Set the stop loss 8 to 12 pips above the recent swing high.
- Target 10 to 20 pips profit or the next nearby support level.
- Close early if the Waddah Attar histogram turns green or the dashboard flips blue.
Advantages
- Strong trend confirmation using multiple timeframes.
- Momentum-based entries improve timing and accuracy.
- Clear visual display suitable for both new and experienced traders.
- Low-risk entries with small stops are ideal for scalping sessions.
- Works well in trending market conditions on major pairs.
Drawbacks
- False signals can occur during flat or ranging markets.
- Requires active monitoring and fast execution on lower timeframes.
- Performance depends on broker spread and execution speed.
Case Study 1 – GBP/JPY M5
During the London session, GBP/JPY showed a strong uptrend across M5, M15, and H1, with all dashboard arrows turning blue.
The Waddah Attar histogram flipped green as momentum increased after a minor retracement.
A buy trade was opened at 187.45 with a stop at 187.30 and a target at 187.70.
The trade reached its target within 20 minutes, yielding 25 pips.
The alignment of the higher-timeframe trend and short-term momentum ensured a clean scalp with minimal drawdown.
Case Study 2 – EUR/USD M15
Later in the New York session, EUR/USD displayed red arrows across the M15 and H1 dashboard timeframes.
The Waddah Attar histogram turned red, confirming renewed selling pressure after a short consolidation.
A sell trade was taken at 1.0892 with a stop loss at 1.0905 and a take profit target of 1.0872.
Within an hour, the price reached the target, producing 20 pips profit.
The method effectively captured the short-term move in line with the broader trend.
Strategy Tips
- Focus on liquid pairs such as EUR/USD, GBP/JPY, and USD/JPY for lower spreads and better execution.
- Trade during high-volume sessions (London and New York) to capture momentum-based opportunities.
- Avoid trading when dashboard timeframes are mixed, as this signals uncertainty.
- Keep risk per trade low, ideally below 2% of your account balance.
- Backtest on different pairs and timeframes to find optimal parameter settings for the Waddah Attar indicator.
Download Now
Download the “Ma trend.mq4” indicator for Metatrader 4
FAQ
How many time frames should I monitor in the dashboard?
It depends on your trading style. Many traders use 3–5 time frames to balance signal reliability and responsiveness. More time frames increase accuracy but may reduce trade frequency.
What does it mean when arrows on different time frames conflict?
When arrows are mixed, it indicates indecision or a weak trend. It’s often better to wait until the majority of time frames align before entering a trade.
Can I adjust which moving averages the dashboard uses?
Yes, you can customize the moving averages in the indicator settings. Adjusting them lets you fine-tune sensitivity and match your trading strategy.
Is this indicator suitable for news trading?
It can be used during news events, but sudden volatility may trigger false signals. Reduce position sizes and consider wider stops if trading around major news.
How do I interpret small trends versus strong trends?
Strong trends show multiple aligned arrows across most time frames. Small or short-term trends may only show alignment in one or two time frames and should be treated cautiously.
Can this dashboard help with trade exits?
Yes. You can use the dashboard arrows to determine when the trend is reversing. Exiting trades when most time frames switch color helps protect profits.
Summary
The Moving Average Trend Dashboard MT4 indicator provides a fast, visual overview of market trends across multiple time frames.
Blue arrows show bullish trends, while red arrows highlight bearish trends, making it easy to identify the dominant market direction.
Traders can quickly see when most time frames align for higher-probability trades.
It is flexible across all currency pairs and time frames, suitable for both scalping and swing trading.
Overall, the indicator simplifies trend analysis and helps traders make confident, timely trading decisions.


