
About the MA Cross Histogram Indicator
The MA Cross Histogram is a free MT4 indicator designed to identify high-probability trends across any currency pair or time frame.
It appears in a separate chart window and displays an oscillator that moves above and below the 0.00 neutral level.
When the histogram rises above 0.00, the trend is bullish, and when it falls below, the trend is bearish.
This gives traders a visual way to gauge market momentum and potential entry points.
The indicator works by calculating the difference between two moving averages and representing this as a colored histogram.
A yellow signal line highlights the crossovers, which traders can use to spot early trend reversals.
This makes it suitable for both short-term scalping and longer-term swing trades.
Free Download
Download the “Ma cross.mq4” indicator for MT4
Key Features
- Oscillator displayed in a separate MT4 window for clarity.
- The histogram indicates bullish or bearish momentum relative to 0.00.
- The yellow signal line shows crossovers for trade entries and exits.
- Alerts and notifications for crossover signals (optional with MT4 setup).
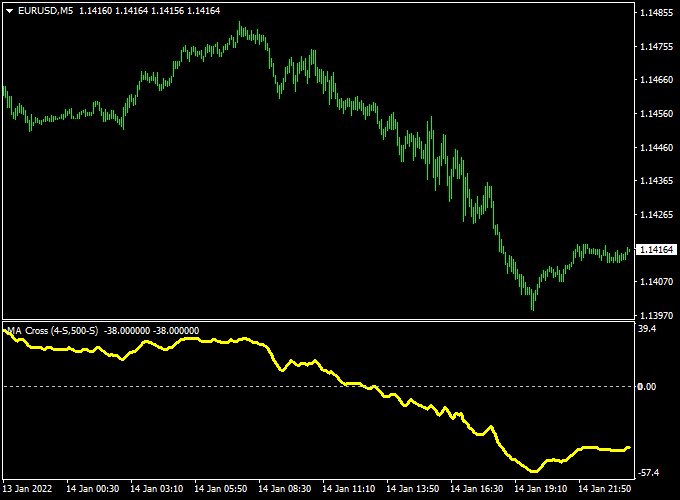
Indicator Chart
The MA Cross Histogram chart shows the oscillator with bullish bars above 0.00 and bearish bars below 0.00.
The yellow signal line highlights crossover points, providing clear buy and sell signals for trend-following strategies.
This example chart demonstrates how the histogram signals market reversals and trend continuation.
Guide to Trade with MA Cross Histogram
Buy Rules
- Open a buy trade when the yellow signal line crosses above the 0.00 level.
- Confirm bullish momentum by observing consecutive bars above 0.00.
- Optional: combine with support levels for higher probability entries.
Sell Rules
- Open a sell trade when the yellow signal line crosses below the 0.00 level.
- Confirm bearish momentum with consecutive bars below 0.00.
- Optional: use resistance zones for additional trade confirmation.
Stop Loss
- For buy trades, place a stop loss below the last swing low.
- For sell trades, place a stop loss above the last swing high.
Take Profit
- Set take profit at 1.5x to 2x the risk, or near key support/resistance levels.
- Consider scaling out partial profits if the trend continues strongly.
Practical Tips
- Use higher time frames for stronger trend confirmation and fewer false signals.
- Combine with other indicators like RSI or EMA for better entry timing.
- Always check multiple time frames to align trades with the overall market trend.
MA Cross Histogram + Lucky Reversal MT4 Day Trading Strategy
The combination of the MA Cross Histogram Indicator for MT4 and the Lucky Reversal Indicator for MT4 provides a reliable and efficient approach for day traders seeking to capture short-term trend reversals with confirmation from momentum shifts.
This setup works best on the 15-minute to 1-hour charts, focusing on intraday movements with clear entry and exit signals.
The strategy is simple, visual, and effective for traders who prefer structured rules rather than guesswork.
The MA Cross Histogram Indicator measures momentum by showing when the short-term moving average crosses above or below the long-term one.
When the histogram moves above zero, it signals a bullish phase, and when it drops below zero, it signals a bearish phase.
The Lucky Reversal Indicator helps spot early turning points in the trend, shown by blue arrows for potential bullish reversals and red arrows for bearish ones.
Combining both creates a filtered system where only high-probability reversals aligned with momentum are traded.
Buy Entry Rules
- Wait for the MA Cross Histogram to move back above the zero line, confirming a shift to bullish momentum.
- Enter a buy trade when a blue arrow appears from the Lucky Reversal Indicator, signaling a reversal to the upside.
- Place the stop loss a few pips below the most recent swing low.
- Set a take profit target of 20–40 pips, depending on volatility.
- Optional: Close half the position when the price reaches +20 pips and trail the stop to break even for the remaining part.
Sell Entry Rules
- Wait for the MA Cross Histogram to move below the zero line, confirming a shift to bearish momentum.
- Enter a sell trade when a red arrow appears from the Lucky Reversal Indicator, signaling a downside reversal.
- Place the stop loss a few pips above the most recent swing high.
- Set a take profit target of 20–40 pips, depending on the strength of the move.
- Optional: Close half the position at +20 pips and let the rest run with a trailing stop.
Advantages
- Clear and easy-to-follow rules suitable for beginners and experienced traders.
- Combines momentum confirmation with early reversal detection.
- Works well during active market sessions such as London or New York.
- Reduces false signals by filtering trades with both histogram and arrow confirmation.
- Applicable to all major currency pairs and time frames from M15 to H1.
Drawbacks
- It may generate fewer signals during ranging or low volatility periods.
- Requires discipline to wait for both confirmation signals before entry.
- Not ideal for scalpers targeting very short-term moves under 10 pips.
Example Case Study 1: EUR/USD 15-Minute Chart
During the London session, the MA Cross Histogram moved from below zero to above zero, showing bullish strength.
A few candles later, the Lucky Reversal Indicator printed a blue arrow near a local bottom at 1.0675.
A buy trade was triggered at 1.0680 with a stop loss at 1.0660 and a target at 1.0720.
The pair rallied strongly within three hours, hitting the target for a 40-pip gain.
The combination of momentum and reversal alignment provided a clear, low-risk setup.
Example Case Study 2: GBP/USD 30-Minute Chart
In the New York morning session, the MA Cross Histogram turned negative, showing momentum shifting downward.
Shortly after, the Lucky Reversal Indicator displayed a red arrow near the top around 1.2820.
A sell position was entered at 1.2815 with a stop at 1.2840 and a take profit at 1.2770.
The move played out over two hours, delivering 45 pips profit as bearish momentum continued.
The dual confirmation prevented premature entries and avoided fake bullish retracements.
Strategy Tips
- Trade only during high-volume sessions to increase signal reliability.
- Always confirm the histogram direction before reacting to a reversal arrow.
- A move back above zero confirms a buy trend; a move below zero confirms a sell trend.
- Skip trades that occur inside narrow ranges or just before major news announcements.
- For better results, combine this setup with support and resistance levels or trendlines for added confluence.
This strategy provides a structured way to catch early reversals supported by momentum.
When applied with patience and proper risk management, it can consistently capture 20–50 pip moves in trending markets.
Download Now
Download the “Ma cross.mq4” indicator for Metatrader 4
FAQ
What makes the MA Cross Histogram different from other oscillators?
Unlike standard oscillators, it shows trend strength relative to the 0.00 level and highlights crossovers with a yellow signal line, helping traders spot early reversals.
Can I use this indicator for scalping?
Yes, it works on lower time frames for quick trades, but signals are more frequent and may produce false entries. Use higher time frames to confirm the trend.
How do I combine it with other MT4 indicators?
Traders often pair it with moving averages, RSI, or support/resistance levels to confirm trend direction and improve the accuracy of buy and sell signals.
Is the indicator suitable for all currency pairs?
Yes, it works with any forex pair, commodities, or indices available on MT4, providing flexible trend analysis across markets.
Does the yellow line give exact entry points?
The yellow signal line highlights crossovers, which serve as entry alerts. Combining it with confirmation from price action or other indicators can increase trade reliability.
Summary
The MA Cross Histogram MT4 indicator is a versatile tool for spotting trend direction and high-probability trade opportunities.
Showing momentum above and below the 0.00 level helps traders quickly identify bullish and bearish conditions.
The yellow signal line highlights key crossover points, allowing precise entry and exit decisions.
Overall, it offers a reliable, actionable view of market momentum without cluttering the main chart, helping traders make informed decisions and manage risk efficiently.


