About the Linear Momentum Forex Indicator
The Linear Momentum Forex Indicator for Metatrader 4 is a technical tool designed to measure market momentum using linear regression principles.
It provides clear buy and sell signals based on the strength and direction of price movement, helping traders identify optimal entries, exits, and short-term trend alignment.
The indicator is displayed in a separate MT4 chart window as a single red line that oscillates above and below the 0.00 neutral level.
This zero line acts as a reference point, allowing traders to quickly assess when momentum is shifting bullishly or bearishly.
The oscillating red line provides a visual representation of market energy, making it easier to spot trading opportunities.
Linear Momentum is versatile and can be used across all currency pairs and timeframes.
Free Download
Download the “Linear-Momentum.mq4” indicator for MT4
Key Features
- Generates buy and sell signals based on linear regression and momentum
- Displays a red oscillating line in a separate chart window
- Signals occur as the line crosses the 0.00 neutral level
- Helps spot trend reversals and momentum shifts efficiently
Indicator Chart
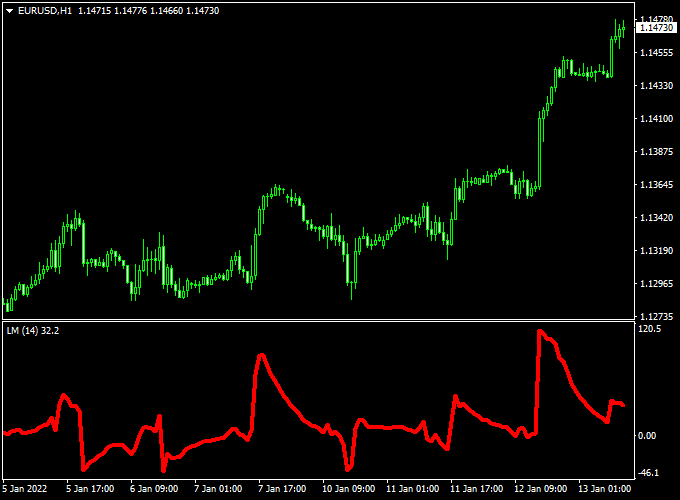
The chart example shows the Linear Momentum Forex Indicator applied to an MT4 chart.
The red line oscillates above and below the 0.00 level, highlighting periods of bullish and bearish momentum.
Crosses above or below the zero line indicate potential trade opportunities in line with market trends.

Guide to Trade with Linear Momentum Forex Indicator
Buy Rules
- Confirm the overall market is in an uptrend
- Enter a buy trade when the red line crosses the 0.00 level from bottom to top
- Consider combining with support levels or a higher timeframe trend for confirmation
Sell Rules
- Confirm the overall market is in a downtrend
- Enter a sell trade when the red line crosses the 0.00 level from top to bottom
- Combine with resistance levels or a higher timeframe trend for added confidence
Stop Loss
- Place stop loss beyond recent swing highs or lows, depending on trade direction
- Adjust stops to account for volatility and market structure
- Use tighter stops for shorter-term momentum trades
Take Profit
- Set take profit near significant support/resistance or previous swing levels
- Consider scaling out partially when momentum weakens
- Let trades run if the red line maintains strong directional movement
Practical Tips
- Use higher timeframe trend direction to filter lower timeframe signals
- Avoid entering trades when the red line oscillates around the zero line without a clear direction
- Combine with other technical indicators like moving averages or support/resistance zones for confirmation
- Monitor momentum strength before opening or exiting positions
MT4 Scalping Strategy Using Linear Momentum and Gann Trend Oscillator MTF Indicators
This MT4 scalping strategy combines the momentum-based signals from the Linear Momentum Forex Indicator with the trend-confirming insights of the Gann Trend Oscillator MTF Indicator.
It is designed for short-term traders looking to capture quick price movements on active currency pairs.
The strategy works best on 1-minute to 5-minute charts, making it ideal for scalpers.
By combining momentum signals with trend confirmation, traders can enter trades with higher probability while filtering out false signals.
The Linear Momentum indicator signals a buy when the price moves back above zero and a sell when it moves back below zero.
The Gann Trend Oscillator uses blue histogram bars for bullish trends and violet bars for bearish trends.
Buy Entry Rules
- Wait for the Linear Momentum indicator to move back above 0, signaling a buy opportunity.
- Confirm the buy with a blue histogram on the Gann Trend Oscillator, indicating a bullish trend.
- Enter a buy trade at the market price once both conditions are met.
- Set a stop loss below the recent swing low or a nearby support level.
- Set a take profit for 5–15 pips or near the next resistance level, depending on market volatility.
Sell Entry Rules
- Wait for the Linear Momentum indicator to move back below 0, signaling a sell opportunity.
- Confirm the sell with a violet histogram on the Gann Trend Oscillator, indicating a bearish trend.
- Enter a sell trade at the market price once both conditions are met.
- Set a stop loss above the recent swing high or a nearby resistance level.
- Set a take profit for 5–15 pips or near the next support level, depending on market volatility.
Advantages
- Combines momentum signals with trend confirmation for higher accuracy.
- Effective on short timeframes, allowing for multiple trades per session.
- Visual signals are easy to interpret, reducing decision-making time.
- Suitable for a variety of currency pairs, including AUD/USD, USD/JPY, and NZD/USD.
Drawbacks
- Rapid price movements can produce false signals if not confirmed by both indicators.
- Scalping on short timeframes requires constant attention and fast execution.
- Frequent trading increases transaction costs, especially with higher spreads.
Case Study 1: AUD/JPY on 1-Minute Chart
On the AUD/JPY 1-minute chart, the Linear Momentum indicator moved back above 0, signaling a buy entry.
The Gann Trend Oscillator displayed blue histogram bars, confirming the bullish trend.
The trade was entered at 89.50, with a stop loss at 89.45 and a take profit set for 5–15 pips or near the next resistance level at 89.60.
The trade closed successfully with a 10-pip gain within 5 minutes.
Case Study 2: NZD/USD on 5-Minute Chart
On the NZD/USD 5-minute chart, the Linear Momentum indicator moved back below 0, signaling a sell entry.
The Gann Trend Oscillator showed violet histogram bars, confirming the bearish trend.
The trade was entered at 0.6500, with a stop loss at 0.6510 and a take profit set for 5–15 pips or near the next support level at 0.6485.
The trade reached the take profit target, netting 15 pips in 10 minutes.
Strategy Tips
- Always wait for confirmation from both indicators to avoid false signals.
- Use recent swing highs and lows to set precise stop loss levels.
- Adjust take profit levels between 5–15 pips or to the next support/resistance, depending on volatility.
- Monitor economic news and events that may cause rapid price spikes.
Download Now
Download the “Linear-Momentum.mq4” indicator for Metatrader 4
FAQ
What does the zero line represent?
The 0.00 level serves as a neutral reference point. Crosses above indicate bullish momentum, while crosses below indicate bearish momentum.
Is it suitable for short-term trading?
Yes. The indicator can be used for scalping or short-term entries, especially when confirming a trend or momentum shift.
Does the indicator repaint?
No. Once a momentum cross occurs, the signal remains fixed. The line continues to oscillate based on live price movement without altering past signals.
Summary
The Linear Momentum Forex Indicator for MT4 provides a clear and efficient way to gauge market momentum and identify potential buy and sell opportunities.
By focusing on linear regression and momentum shifts, traders can enter and exit trades with greater precision.
Displayed as a red line in a separate chart window, the indicator helps visualize momentum trends and short-term price energy.
It can be used independently or as a filter for other trading strategies.
By observing how the red line interacts with the 0.00 level, traders can identify high-probability entries, manage stop loss and take profit levels effectively, and maintain disciplined trading aligned with market momentum.


