
About the Linear Price Bar Forex Indicator
The Linear Price Bar Forex Indicator for Metatrader 4 is a simple yet effective tool that visualizes market direction using colored candlesticks.
It displays blue and red bars in a separate MT4 window, helping traders quickly assess whether the market is trending bullish or bearish.
Blue candlesticks indicate bullish momentum, while red candlesticks show bearish pressure.
Traders can make informed decisions on entries, exits, or trend confirmation without relying on complex calculations.
It can be used alone for trend spotting or combined with other technical tools to refine trade timing.
Free Download
Download the “Linear_Price_Bar.mq4” indicator for MT4
Key Features
- Displays trend direction using colored candlesticks in a separate chart window
- Blue candlesticks indicate bullish conditions
- Red candlesticks indicate bearish conditions
- Can be used for trade entries, exits, or as a price action filter
- Lightweight and easy to interpret
Indicator Chart
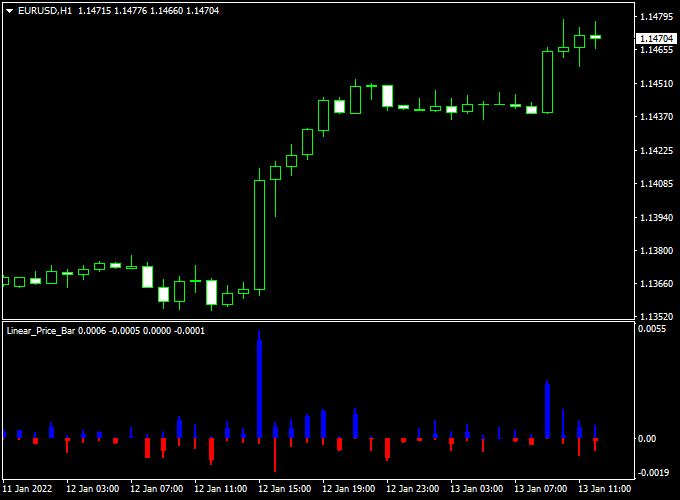
The chart example shows the Linear Price Bar indicator applied to an MT4 chart.
Blue candlesticks signal bullish momentum, while red candlesticks show bearish momentum.
Observing these bars helps traders align trades with the prevailing trend.
Guide to Trade with Linear Price Bar Forex Indicator
Buy Rules
- Enter a buy trade when consecutive blue bars appear in the indicator window
- Confirm the overall market trend supports bullish conditions
- Use additional support levels or higher timeframe trends for confirmation
Sell Rules
- Enter a sell trade when consecutive red bars appear in the indicator window
- Confirm the market trend supports bearish conditions
- Combine with resistance levels or higher timeframe analysis for better accuracy
Stop Loss
- Place a stop loss below the recent swing low for buy trades
- Place a stop loss above the recent swing high for sell trades
Take Profit
- Set targets near major support/resistance zones
- Consider scaling out partially when momentum shifts in the indicator
- Let trades run in strong trending conditions confirmed by consecutive bars
Practical Tips
- Combine with trend confirmation tools for higher probability entries
- Use higher timeframe trends to filter lower timeframe entries
- Observe how the color changes in response to price to anticipate potential reversals
MT4 Scalping Strategy Using Linear Price Bar and XTC Forex Trend Indicators
This MT4 scalping strategy combines the price-action signals from the Linear Price Bar Forex Indicator with the trend confirmation of the XTC Forex Trend Indicator.
It is designed for traders seeking quick scalping opportunities on short timeframes.
The strategy works best on 1-minute to 5-minute charts.
The Linear Price Bar indicator shows a blue candlestick as a buy signal and a red candlestick as a sell signal.
The XTC Forex Trend indicator uses a blue histogram for bullish trends and a red histogram for bearish trends.
Take profit targets are set between 3–7 pips to capture small but consistent movements.
Buy Entry Rules
- Wait for a blue candlestick on the Linear Price Bar indicator, signaling a buy opportunity.
- Confirm the trade with a blue histogram on the XTC Forex Trend Indicator, indicating a bullish trend.
- Enter a buy trade at the market price once both conditions are met.
- Set a stop loss just below the recent swing low.
- Set a take profit for 3–7 pips depending on market volatility.
Sell Entry Rules
- Wait for a red candlestick on the Linear Price Bar indicator, signaling a sell opportunity.
- Confirm the trade with a red histogram on the XTC Forex Trend Indicator, indicating a bearish trend.
- Enter a sell trade at the market price once both conditions are met.
- Set a stop loss just above the recent swing high.
- Set a take profit for 3–7 pips depending on market volatility.
Advantages
- Combines price-action signals with trend confirmation for higher accuracy.
- Works well on short timeframes, allowing multiple trades per session.
- Simple visual signals make it easy to interpret.
- Suitable for various currency pairs, including AUD/USD, USD/JPY, and EUR/JPY.
Drawbacks
- Scalping requires constant attention and quick execution.
- Small pip targets may be affected by spreads or broker execution delays.
- Frequent trades increase transaction costs.
- False signals can occur during low liquidity or news events.
Case Study 1: AUD/JPY on 1-Minute Chart
On the AUD/JPY 1-minute chart, a blue candlestick appeared on the Linear Price Bar indicator, signaling a buy entry.
The XTC Forex Trend Indicator showed a blue histogram, confirming the bullish trend.
The trade was entered at 89.50, with a stop loss at 89.47 and a take profit of 3–7 pips.
The trade closed successfully with a 5-pip gain within 4 minutes.
Case Study 2: NZD/USD on 5-Minute Chart
On the NZD/USD 5-minute chart, a red candlestick appeared on the Linear Price Bar indicator, signaling a sell entry.
The XTC Forex Trend Indicator displayed a red histogram, confirming the bearish trend.
The trade was entered at 0.6500, with a stop loss at 0.6503 and a take profit of 3–7 pips.
The trade reached the take profit target, netting 6 pips in 8 minutes.
Strategy Tips
- Always wait for confirmation from both indicators to avoid false signals.
- Use recent swing highs and lows to set precise stop loss levels.
- Set take profit between 3–7 pips to match typical scalping volatility.
Download Now
Download the “Linear_Price_Bar.mq4” indicator for Metatrader 4
FAQ
What do the colors represent?
Blue bars indicate bullish momentum, while red bars indicate bearish momentum. They help visualize short-term trend direction.
Can this indicator be used on all timeframes?
Yes. It works effectively on all MT4 timeframes, making it suitable for both intraday and longer-term trading strategies.
Is it possible to use the indicator for scalping?
Yes. The indicator can be used for scalping by following rapid color changes and confirming entries with higher timeframe trends or support/resistance levels.
Summary
The Linear Price Bar Forex Indicator for MT4 provides a clear visual overview of market trends using simple colored bars.
By monitoring blue and red candlesticks, traders can identify bullish and bearish momentum quickly.
The indicator is versatile across all MT4 timeframes and symbols and can be used for trade entries, exits, or as a price action filter.
Its simplicity makes it easy to incorporate into any trading strategy.


