About the Ichi360 v8 Forex Signal Indicator
The Ichi360 v8 Forex Signal Indicator for MT4 analyzes trends across multiple timeframes and displays the overall market sentiment in a mini dashboard.
It shows the percentage of bullish or bearish momentum, helping traders identify potential trend directions without manually comparing charts.
Beginner-friendly yet powerful for experienced traders, the indicator works on any currency pair and timeframe.
By providing clear buy or sell signals based on trend strength, it allows traders to enter and exit trades with confidence.
It can also be combined with your favorite strategies for improved accuracy and performance.
Free Download
Download the “ichi360v8.ex4” indicator for MT4
Key Features
- Displays multi-timeframe trend analysis in a compact dashboard
- Shows the percentage bullish or bearish to indicate trend strength
- Provides clear buy or sell signals when thresholds are reached
- Can be used alone or combined with other trading strategies
- Lightweight and beginner-friendly
Indicator Chart
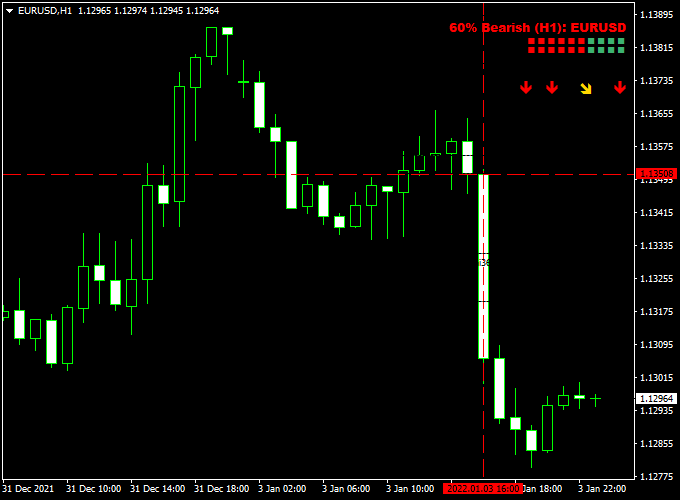
The chart below shows the Ichi360 v8 Forex Signal Indicator dashboard.
The % bullish and % bearish values indicate trend strength, guiding traders when to enter or exit trades.
Signals above 75% indicate strong buy or sell opportunities.

Guide to Trade with Ichi360 v8 Forex Signal Indicator
Buy Rules
- Enter a buy trade when the dashboard shows 75% Bullish or higher
- Exit or reverse position if 75% Bearish appears
Sell Rules
- Enter a sell trade when the dashboard shows 75% Bearish or higher
- Exit or reverse position if 75% Bullish appears
Stop Loss
- Place below the recent swing low for buys
- Place above the recent swing high for sells
Take Profit
- Set at the next support/resistance level
- Or exit when the opposite signal percentage threshold is reached
Practical Tips
- Combine with trend-following or momentum indicators for stronger entries
- Monitor percentage changes dynamically to time exits and reversals
- Consider combining with candlestick patterns for more precise entries
Ichi360 V8 + Wolfe Wave MT4 Intraday Strategy
This intraday strategy combines the Ichi360 V8 Forex Signal Indicator for MT4 with the Wolfe Wave Forex Indicator for MT4.
The strategy is designed to catch high-probability intraday moves by combining trend strength with precise reversal patterns.
Ichi360 V8 provides market sentiment in percentages, helping traders determine strong bullish or bearish conditions.
The Wolfe Wave indicator identifies natural price patterns and projection levels for entries and exits.
This strategy works well on M15 and H1 charts.
It is suitable for active forex traders who want clear signals with defined entry and exit rules.
The system is designed to simplify decision-making by only taking trades where both trend strength and pattern alignment are present.
Buy Entry Rules
- Wait for Ichi360 V8 to show “75% Bullish” or higher, indicating a strong upward trend.
- Look for a bullish Wolfe Wave pattern forming near support.
- Enter a buy trade when the price breaks above the Wolfe Wave trendline with confirming bullish candles.
- Place a stop loss just below the nearest support or the last low of the Wolfe Wave pattern.
- Set take profit at the projected target line of the Wolfe Wave (point 6) or a 1.5–2 times risk-to-reward ratio.
Sell Entry Rules
- Wait for Ichi360 V8 to show “75% Bearish” or higher, indicating a strong downward trend.
- Identify a bearish Wolfe Wave pattern forming near resistance.
- Enter a sell trade when the price breaks below the Wolfe Wave support line with confirming bearish candles.
- Place a stop loss just above the nearest resistance or the last high of the Wolfe Wave pattern.
- Set take profit at the projected Wolfe Wave target or a 1.5–2 times risk-to-reward ratio.
Advantages
- Combines trend strength and reversal patterns for higher probability trades.
- Provides clear entry and exit points.
- Easy to follow, even for beginners, once familiar with Wolfe Wave patterns.
- Works on multiple forex pairs and timeframes.
- Helps reduce false entries by requiring alignment of trend and pattern.
Drawbacks
- Requires patience to wait for both trend confirmation and Wolfe Wave completion.
- Less effective during low volatility or choppy markets.
- Manual recognition of Wolfe Waves can be challenging for new traders.
- Missed opportunities can occur if the price moves quickly through zones.
- Stop loss and take profit placement must be precise for success.
Example Case Study 1
On the EURUSD H1 chart during the London session, Ichi360 V8 displayed 83% Bullish.
A bullish Wolfe Wave pattern formed near a strong support level.
Price broke above the trendline with confirming candles, and a buy trade was opened.
The stop loss was placed below the pattern low.
Price moved steadily toward the projected target, yielding 76 pips before a minor pullback occurred.
Example Case Study 2
On GBPUSD H1, Ichi360 V8 showed 79% Bearish.
A bearish Wolfe Wave formed near a resistance level. Price broke below the trendline, confirming the setup.
A sell trade was entered with the stop loss above the wave high.
The take profit was reached as the price declined to the projected point, generating 89 pips profit in less than one trading session.
Strategy Tips
- Focus on M15 and H1 charts for the best balance between signal reliability and trade frequency.
- Trade only when both Ichi360 V8 and Wolfe Wave align.
- Avoid trading during major news events that could cause sudden spikes.
- Limit trades to one or two pairs to monitor patterns effectively.
- Use disciplined risk management, risking no more than 1–2% per trade.
- Backtest the strategy on historical charts to understand pattern formation and target accuracy.
Download Now
Download the “ichi360v8.ex4” indicator for Metatrader 4
FAQ
How does the Ichi360 v8 Indicator work?
It analyzes multiple timeframes and displays overall bullish or bearish trend percentages on a dashboard, indicating potential entry or exit points.
Do I need other indicators to trade effectively?
While it can be used alone, combining it with trend or momentum indicators improves accuracy and timing.
What thresholds should I use for signals?
Buy when bullish percentage is 75% or higher; sell when bearish percentage is 75% or higher. Adjust based on personal risk tolerance.
Summary
The Ichi360 v8 Forex Signal Indicator is a powerful tool for tracking multi-timeframe trends in MT4.
Its dashboard clearly displays percentage bullish or bearish readings, allowing traders to spot strong buy or sell opportunities with confidence.
It is beginner-friendly, lightweight, and suitable for any currency pair or timeframe.
Combining this indicator with other trend or candlestick indicators enhances trade accuracy.
Following percentage thresholds for entries and exits can help traders capture profitable trends efficiently.


