
About the Disparity Index Indicator
The Disparity Index (DI) is a technical momentum indicator that measures the percentage difference between the current price and a moving average.
Developed by Steve Nison, it provides insights into overbought or oversold conditions, helping traders identify potential trend reversals or continuations.
The DI is particularly useful in detecting price discrepancies and assessing market momentum.
Free Download
Download the “disparity-index.mq4” indicator for MT4
Key Features
- Measures the percentage difference between the current price and a moving average.
- Helps identify overbought or oversold market conditions.
- Useful in detecting trend reversals or continuations.
- Works across all timeframes and currency pairs.
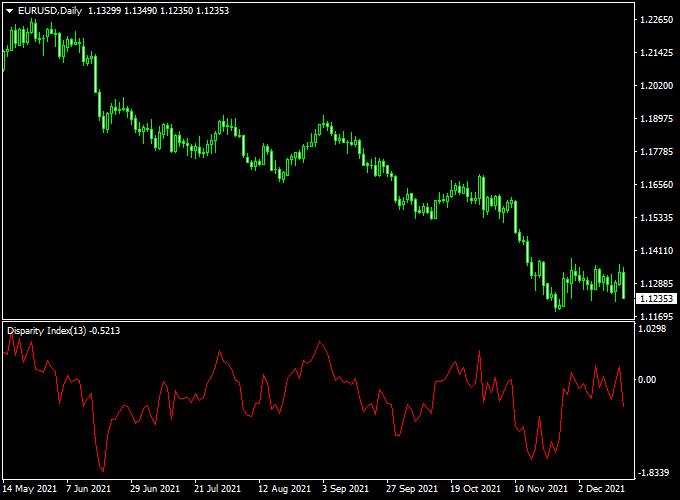
Indicator Example Chart (EUR/USD Daily)
Below is an example chart showcasing the Disparity Index in action.
The indicator oscillates around a zero line, with values above zero indicating an uptrend and values below zero indicating a downtrend.
How to Trade Using This Indicator
Entry Rules
- Enter a buy trade when the Disparity Index crosses above the zero line, indicating bullish momentum.
- Enter a sell trade when the Disparity Index crosses below the zero line, signaling bearish momentum.
Stop Loss and Take Profit
- For buy trades, place your stop loss slightly below the nearest swing low or a key support level to protect against sudden reversals.
- For sell trades, place your stop loss just above the nearest swing high or resistance zone.
- Set take profit at the next major support/resistance area or use a risk-to-reward ratio of 1:2 or higher to maximize gains.
- Consider using a trailing stop to lock in profits as the trend progresses, adjusting dynamically based on price action and volatility.
The X Super Trend Candles Disparity Index MT4 Strategy
This strategy combines the X Super Trend Candles Indicator with the Disparity Index Indicator to create a powerful and well-filtered trading system.
The X Super Trend Candles indicator serves as a trend filter by coloring the candlesticks, making it easy to see the market’s overall direction.
The Disparity Index indicator acts as a precise signal generator, providing the final trigger for entries by crossing its zero line.
By using this dual-indicator approach, you can ensure that your trades are always in the direction of the dominant trend, which significantly increases your probability of success.
Buy Entry Rules
- The X Super Trend Candles indicator displays green-colored candlesticks, confirming a bullish trend.
- The Disparity Index indicator’s signal line crosses the 0.00 level from the bottom up, signaling a buy opportunity.
- Stop Loss: Place your stop loss below the most recent swing low.
- Take Profit: Exit when the Disparity Index signal line crosses back below the 0.00 level, or when the X Super Trend Candles change to a red color.
Sell Entry Rules
- The X Super Trend Candles indicator displays red-colored candlesticks, confirming a bearish trend.
- The Disparity Index indicator’s signal line crosses the 0.00 level from the top down, signaling a sell opportunity.
- Stop Loss: Place your stop loss above the most recent swing high.
- Take Profit: Exit when the Disparity Index signal line crosses back above the 0.00 level, or when the X Super Trend Candles change to a green color.
Advantages
- High-Quality Signals: The dual confirmation from a trend filter and an entry signal significantly increases the probability of a successful trade.
- Reduced Noise: The X Super Trend Candles indicator helps to filter out minor market fluctuations, allowing you to focus on the main trend.
Case Studies
Case Study 1: Buy Trade
On a 5-minute chart for EUR/USD, the candlesticks turned green, confirming a strong uptrend.
The Disparity Index signal line then crossed the 0.00 level from the bottom up.
A buy trade was entered with a stop loss placed below the recent swing low.
The price continued its upward momentum, and the trade was successfully closed for a solid profit when the Disparity Index signal line crossed back below 0.00, signaling a potential reversal.
Case Study 2: Sell Trade
On an H4 chart for USD/JPY, the candlesticks turned red, signaling a clear downtrend.
The Disparity Index signal line then crossed the 0.00 level from the top down, giving a sell signal.
A sell trade was opened with a stop loss placed above the recent swing high.
The price dropped sharply over the next few hours, and the trade was exited for a significant profit when the X Super Trend Candles turned back to a green color.
Strategy Tips
- Confirm the Trend: Always ensure the X Super Trend Candles are clearly showing a strong, defined trend before looking for a signal from the Disparity Index.
- Trade with Discipline: Stick to the rules. Do not enter a trade if both indicators are not in clear agreement. Patience is key to making this system work.
Download Now
Download the “disparity-index.mq4” indicator for Metatrader 4
Indicator Specifications
| Specification | Detail |
|---|---|
| Platform | MetaTrader 4 (MT4) |
| Timeframes | All Timeframes |
| Markets | Forex, CFDs, Indices, Commodities, Cryptocurrencies |
| Signal Type | Oscillator |
| Repainting | No |
| Inputs | Adjustable moving average period |
FAQ — Practical Questions Traders Ask
1. Can the Disparity Index help spot trend reversals?
Yes, extreme values above or below a certain threshold often indicate overbought or oversold conditions.
Traders can look for divergence between price and the DI to spot potential reversals.
2. How can I avoid false signals in ranging markets?
During sideways markets, DI crossovers can give false signals.
Combine the indicator with a volatility filter or ADX to ensure trades are taken only when the market has sufficient momentum.
3. Can I use it on multiple timeframes?
Absolutely. Use the Disparity Index on a higher timeframe to determine the main trend and a lower timeframe to time entries.
This multi-timeframe approach reduces the risk of trading against the overall trend.
Summary
The Disparity Index is a versatile and straightforward indicator that can enhance your trading strategy.
By measuring the percentage difference between the current price and a moving average, it provides insights into market momentum and potential trend reversals.
When used in conjunction with other technical analysis tools, the Disparity Index can help you make more informed trading decisions.


