About the CHIFBAW Oscillator (MT4)
The CHIFBAW Oscillator for MetaTrader 4 is a momentum-and-trend timing tool that plots a zero-line oscillator with clear color changes and signal markers to highlight potential reversals and trend continuations.
Instead of reading raw price swings, traders can quickly assess momentum strength, identify exhaustion in overbought/oversold zones, and act on objective signals.
It’s designed for intraday and swing trading on Forex, indices, and gold. Use it as a standalone timing filter or combine it with simple structure tools (EMAs, S&R) for higher-probability entries.
Buy & sell signal
- A buy signal occurs as soon as the histogram bars turn back above the 0.00 level.
- A sell signal occurs as soon as the histogram bars turn back below the 0.00 level.
Free Download
Download the “Chifbaw_Oscillator.ex4” indicator for MT4
Key Features
- Zero-Line Momentum: Read bullish/bearish bias at a glance.
- Color-Coded Histogram/Line: Quick visual shift when momentum flips.
- Overbought/Oversold Bands: Spot exhaustion and mean-reversion opportunities.
- Signal Markers: Optional arrows/labels on crosses or slope changes.
- Alerts: Popup, sound, email, and push notifications (configurable).
- Multi-Timeframe Friendly: Works from M1 to D1; optional HTF filter.
- Lightweight: Minimal chart clutter and low CPU usage.
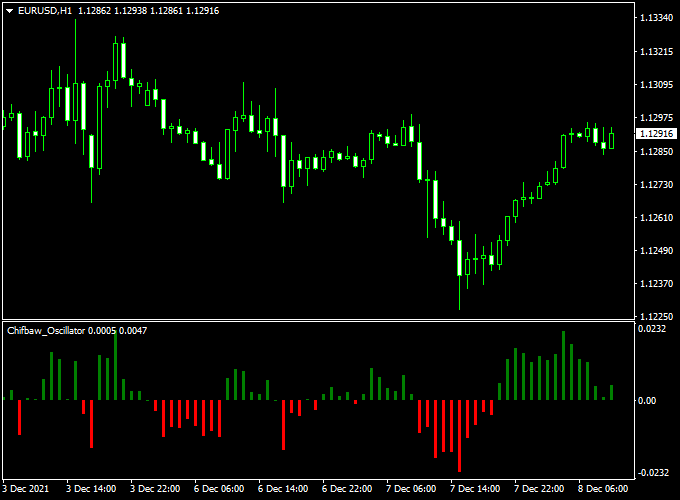
Indicator Example Chart (EUR/USD H1)
Illustrative chart showing bullish momentum above the zero line (green) and bearish momentum below (red):

How To Trade Using This Indicator
Recommended Filters
- Trend: EMA 200 (directional bias) + EMA 50 (near-term momentum).
- Structure: Prior swing highs/lows, daily S&R, round numbers.
- Sessions: Focus on London and NY overlap for cleaner intraday moves.
Entry Rules
Buy Setup
- Price trades above EMA 200 (uptrend) or forms higher highs/lows.
- CHIFBAW crosses above the zero line or turns from oversold back upward.
- Entry: Buy on the candle close that confirms the cross/turn, or on a small pullback to the signal candle’s 50% level.
Sell Setup
- Price trades below EMA 200 (downtrend) or forms lower highs/lows.
- CHIFBAW crosses below the zero line or turns from overbought downward.
- Entry: Sell on the candle close that confirms the cross/turn, or on a small pullback to the signal candle’s 50% level.
Stop Loss & Take Profit
- Stop Loss:
- Buys: below the signal bar’s low or the most recent swing low.
- Sells: above the signal bar’s high or the most recent swing high.
- Take Profit:
- Conservative: 1.5R–2R risk multiples or next S&R level.
- Aggressive: Trail below/above swing structure; exit when CHIFBAW flattens or crosses back through zero.
- Management: Consider taking partial profits at 1R and move SL to breakeven.
Download Now
Download the “Chifbaw_Oscillator.ex4” indicator for Metatrader 4
Chifbaw Oscillator & Limited Donchian Channel MT4 Strategy
This strategy combines the Chifbaw Oscillator Forex Indicator with the Limited Donchian Channel Forex Indicator to identify high-probability market reversal points.
The Chifbaw Oscillator provides momentum-based buy and sell signals, while the Limited Donchian Channel offers dynamic support and resistance levels, aiding traders in making informed decisions.
Buy and Sell Rules
Buy Setup
- Wait for the Chifbaw Oscillator to display a green bar above the zero line, indicating upward momentum.
- Ensure the price is at the upper green band of the Limited Donchian Channel, confirming an uptrend.
- Enter a buy trade at the close of the confirmation candle.
- Place a stop loss below the lower band of the Limited Donchian Channel.
- Set take profit at a risk-reward ratio of 1:2 or near the next significant resistance level.
Sell Setup
- Wait for the Chifbaw Oscillator to display a red bar below the zero line, indicating downward momentum.
- Ensure the price is at the lower red band of the Limited Donchian Channel, confirming a downtrend.
- Enter a sell trade at the close of the confirmation candle.
- Place a stop loss above the upper band of the Limited Donchian Channel.
- Set take profit at a risk-reward ratio of 1:2 or near the next significant support level.
Trader Case Studies
Below are examples of traders who applied this strategy to different currency pairs and timeframes, demonstrating its effectiveness in various market conditions.
Leila T – Morocco
Leila T, a swing trader from Morocco, applied this strategy on the EUR/USD and USD/CHF pairs over 22 days. She achieved a total profit of +285 pips, attributing her success to the clear momentum signals and reliable channel breakouts.
David F – Canada
David F, a part-time trader from Canada, used this strategy on the GBP/USD and USD/JPY pairs with a 30-minute timeframe. Over 30 days, he recorded net gains of +320 pips. David highlighted the effectiveness of combining momentum and price action for optimal trade entries.
Nguyen H – Vietnam
Nguyen H, a day trader from Vietnam, traded the AUD/USD pair using this strategy for 18 days and realized a profit of +210 pips. He emphasized the importance of patience and waiting for both indicators to align before executing trades.
Disclaimer: These case studies are for educational purposes only. Trading results will vary depending on market conditions, risk management, and individual discipline.
Advantages of This Strategy
- Combines momentum-based signals with dynamic support and resistance levels for higher accuracy.
- Suitable for various timeframes and currency pairs.
- Helps in identifying optimal entry and exit points.
- Reduces false signals by aligning two reliable indicators.
Drawbacks and Considerations
- Requires discipline to wait for both indicators to confirm before entering trades.
- May underperform in highly volatile or sideways markets.
- Effective risk management is essential to protect capital.
- May require frequent monitoring depending on the chosen timeframe.
Strategy Conclusion and Tips
This combined strategy offers a robust approach to trading by integrating momentum-based signals with dynamic support and resistance levels.
Traders should ensure both indicators align before entering trades to maximize success.
Proper stop loss and take profit settings tailored to market conditions are crucial for risk control.
Indicator Specifications
| Platform | MetaTrader 4 (MT4) |
|---|---|
| Markets | Forex, Indices, Metals, Crypto (CFD) |
| Timeframes | M1–D1 |
| Drawing | Oscillator line/histogram with color changes and optional arrows |
| Alerts | Popup, Sound, Email, Push (optional) |
| Inputs |
|
FAQ
Does the CHIFBAW Oscillator repaint?
The oscillator updates in real time, but signals based on bar-close conditions should remain fixed once the candle closes.
Which pairs and sessions work best?
Major pairs (EURUSD, GBPUSD, USDJPY) and XAUUSD during London and NY sessions generally provide cleaner momentum turns.
Can I use it without any other indicators?
Yes, but results typically improve when combined with a trend filter (EMA 200) and clear support/resistance.
What SL/TP do you recommend?
Structure-based stops beyond the signal swing with 1.5R–2R targets as a baseline; consider trailing if momentum persists.
What timeframe is best for beginners?
M15–H1 strikes a good balance between frequency and noise before experimenting with lower timeframes.
Final Words
The CHIFBAW Oscillator turns momentum assessment into a simple, visual process.
Combine its zero-line bias with a straightforward trend filter and price levels to build a repeatable plan, then forward-test on demo to fine-tune your SL/TP and management rules
before going live.


