About the Bigger Time Frames Candles Indicator
The Bigger Time Frames Candles Forex indicator displays bigger time frame bullish & bearish candles on the MT4 main chart window.
The bullish and bearish candles are based on the bigger time frames and give you an idea of where the major trend is heading.
The indicator can be used to trade breakouts above or below the bigger candlesticks.
Key Takeaways
- A blue candlestick represents an uptrending market.
- A red candlestick represents a down-trending market.
- Pure price action, no lag.
- Simple to use.
The indicator works equally well for all currency pairs and shows promising results if used correctly.
Free Download
Download the “bigger-tf-candles-week-day.mq4” indicator for MT4
Key Features
- Displays higher timeframe candles (H1, H4, Daily, etc.) on lower timeframe charts
- Real-time updates as the market evolves
- Customizable timeframe selection
- Color-coded bullish and bearish candles for clarity
- Works on all currency pairs and chart types
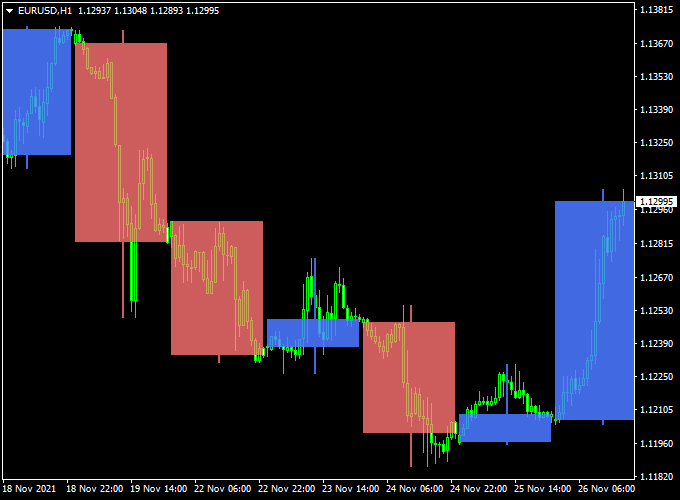
Indicator Example Chart (EUR/USD H1)
The screenshot below shows how H4 candles appear clearly outlined on an H1 chart. Bullish candles are blue, and bearish candles are red.
This makes trend structure and higher-timeframe signals easy to read at a glance.

How To Trade Using This Indicator
Here’s how to apply it:
- Identify higher timeframe candle formations directly on your current chart.
- Look for bullish candles forming on the overlay before entering buy positions.
- Look for bearish candles forming on the overlay before entering sell positions.
- Combine this insight with your regular signals or price action tools.
- Place stop loss below/above the higher timeframe candle low/high for safety.
- Use take profit at the next key structure or based on risk/reward ratio.
Download Now
Download the “bigger-tf-candles-week-day.mq4” indicator for Metatrader 4
Multi-Timeframe Candle + Precision Entry Forex Strategy (MT4)
This strategy combines the strength of multi-timeframe trend confirmation with precision entry and exit signals.
By using the Bigger Time Frames Candles Indicator alongside the Entry & Take Profit Winner Indicator, traders can capture high-probability trades with reduced noise and clearer trend context.
This method is suitable for intraday to swing trading styles and can be applied across various currency pairs.
What Is This Strategy About?
This strategy focuses on aligning entries with the dominant trend shown by higher-timeframe candle overlays.
The Bigger Time Frames Candles Indicator provides visual guidance from a larger timeframe, helping traders stay on the right side of the trend.
Once direction is confirmed, the Entry & Take Profit Winner Indicator gives precise entry signals, along with take profit and stop-loss levels to manage the trade efficiently.
Buy Trade Setup
Conditions:
- The higher-timeframe candle (overlay) is bullish (blue) from the Bigger Time Frames Candles Indicator.
- A blue arrow from the Entry & Take Profit Winner Indicator appears, signaling a buy entry.
Entry:
Place a buy trade at the open of the next candle after the blue arrow appears.
Stop Loss:
Set the stop-loss level as indicated by the Entry & Take Profit Winner Indicator (usually just below the recent swing low).
Take Profit:
Follow the take profit level marked by the indicator. Optionally, close part of the position early at 1:1 RR and trail the rest.
Sell Trade Setup
Conditions:
- The higher-timeframe candle (overlay) is bearish (red) from the Bigger Time Frames Candles Indicator.
- A red arrow from the Entry & Take Profit Winner Indicator appears, signaling a sell entry.
Entry:
Enter a sell trade at the open of the next candle after the red arrow is shown.
Stop Loss:
Set the stop-loss level at the price suggested by the indicator (typically just above the recent high).
Take Profit:
Use the indicator’s take profit line. Adjust as necessary for risk management or trailing stop strategies.
Case Study 1
EUR/USD M5 Chart Analysis (25-Day Sample Period):
- Total Signals: 30 trades
- Winning Trades: 21 (70%)
- Average Win: +28 pips
- Average Loss: -12 pips
- Net Result: +480 pips over the testing period
Case Study 2
GBP/JPY M15 Chart Analysis (30-Day Sample Period):
- Total Signals: 38 trades
- Winning Trades: 24 (63.1%)
- Average Win: +36 pips
- Average Loss: -18 pips
- Net Result: +486 pips over the testing period
Advantages
- Filters out noise by aligning with a higher timeframe direction.
- Clear entry, stop loss, and take profit signals make execution easy for beginners.
- Reduces overtrading by focusing on quality setups only.
- Flexible enough to be used across different timeframes and pairs.
Drawbacks
- May miss fast-moving opportunities when waiting for both indicators to align.
- Performance may vary during choppy or low-volume market conditions.
- Relies on visual cues; discretionary judgment may still be needed in volatile markets.
Strategy Conclusion
By combining higher-timeframe trend context with accurate entry and exit signals, this strategy offers a structured and efficient way to trade forex.
Both indicators: Bigger Time Frames Candles, and Entry & Take Profit Winner work in harmony to give traders the confidence and clarity they need to improve performance across major currency pairs.
Indicator Specifications
| Indicator Name | Bigger Time Frames Candles Indicator |
|---|---|
| Platform | MetaTrader 4 |
| Timeframes | All (overlay from H1 to Monthly) |
| Currency Pairs | All Forex pairs, indices, and commodities |
| Inputs |
|
| Repaint | No |
Final Words
The Bigger Time Frames Candles Indicator for MT4 is an essential visual tool for traders who rely on multi-timeframe analysis.
By placing higher timeframe candles right on your trading chart, you gain a clearer view of the market structure and avoid going against the trend.
Combine it with your favorite strategy or indicator for even better results.
Download it now and boost your market perspective with smarter, multi-timeframe trading decisions.


