About the ATR Labeled Calculator Indicator
The ATR Labeled Calculator Indicator for MT4 displays the current Average True Range (ATR) value directly on your chart with clear, labeled readings.
This tool is extremely helpful for identifying volatility levels, adjusting stop-loss distances, and measuring market movement in real time.
It’s lightweight, fast, and suitable for all trading strategies.
Key Features of the Indicator
- Displays ATR value in pips directly on the chart
- Real-time ATR label updates dynamically
- Customizable period and display settings
- Simple and clean interface for easy reading
- Works on all timeframes and forex pairs
Free Download
Download the “atr-chart-labeled.mq4” indicator for MT4
How the Indicator Works
This indicator calculates the Average True Range (ATR) of the selected timeframe and shows it on the screen as a labeled value.
ATR is a measure of volatility; the higher the ATR value, the greater the recent price movement.
Traders often use it to determine optimal stop-loss levels, take-profit targets, or position sizing based on current market conditions.
Benefits of Using the ATR Labeled Calculator
- Instantly see market volatility in pips
- Plan your stop loss and take profit more accurately
- Adapt trade size and timing to current volatility
- Supports better risk management
- Perfect for scalping, swing trading, and day trading
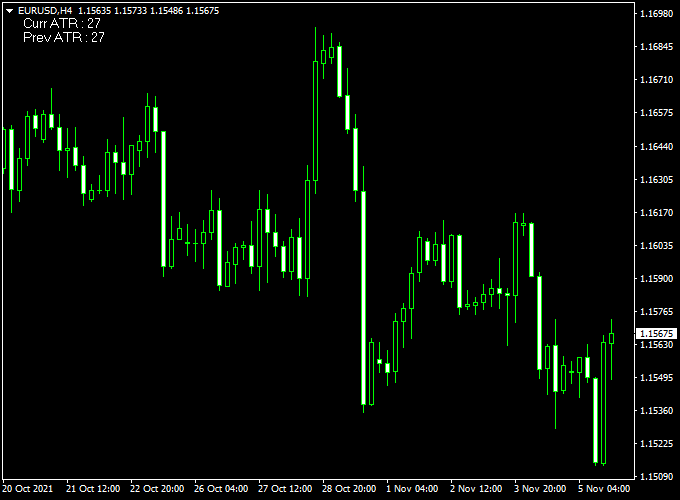
Indicator Example Chart (EUR/USD H4)

How to Trade Using This Indicator
The trading logic for the ATR Labeled Calculator is simple: use the ATR reading to guide your risk and reward decisions.
Example Use Case:
- If ATR is reading 20 pips, expect the average price movement to be around 20 pips over the given period.
- Use this value to set your stop-loss: e.g., a stop-loss of 1x or 1.5x the ATR.
- Set your take-profit at 1.5x to 2x the ATR, depending on the trade setup and strategy.
Stop Loss & Take Profit Planning:
- Low ATR = less movement, tighter SL/TP
- High ATR = more movement, wider SL/TP
You can also combine this indicator with your favorite entry system to fine-tune your position size and trade timing based on real-time volatility.
ATR Labeled Calculator + Bollinger Bands Stop V2 Strategy for MT4
This strategy combines the precise volatility measurement of the ATR Labeled Calculator Forex Indicator with the dynamic trailing stop and trend filtering of the Bollinger Bands Stop V2 Indicator.
Together, these tools help traders identify strong trend entries and manage exits effectively on the MetaTrader 4 platform.
What Is This Strategy About?
The ATR Labeled Calculator indicator displays the Average True Range with clear labels, helping traders gauge current market volatility and set realistic stop loss and take profit levels.
The Bollinger Bands Stop V2 Indicator uses Bollinger Bands combined with a trailing stop mechanism to signal trend direction and generate stop loss alerts that adapt to price movements.
This strategy aims to enter trades during strong trending phases confirmed by ATR volatility levels and exit using dynamic Bollinger Band stops.
Buy Rules
- Check that the ATR value from the ATR Labeled Calculator indicates sufficient volatility to support a trade.
- Wait for the Bollinger Bands Stop V2 Indicator to signal an uptrend, usually shown by price closing above the Bollinger Bands stop line.
- Enter a buy trade at the open of the next candle after confirmation.
- Set stop loss using the Bollinger Bands trailing stop line or at a multiple of the ATR value below the entry.
- Use the ATR value to calculate take-profit targets based on the current market volatility.
- Trail stops with the Bollinger Bands Stop V2 to lock in profits as the trend develops.
Sell Rules
- Ensure ATR indicates adequate volatility from the ATR Labeled Calculator.
- Wait for the Bollinger Bands Stop V2 to signal a downtrend, often when price closes below the trailing stop line.
- Enter a sell trade at the next candle open once confirmed.
- Place a stop loss above the Bollinger Bands trailing stop or at a calculated ATR multiple above the entry price.
- Set take profit targets considering the ATR volatility measurement.
- Trail stops using the Bollinger Bands Stop V2 trailing mechanism to protect gains.
Advantages
- Volatility-based trade sizing: ATR provides clear data for stop loss and take profit calculation.
- Dynamic trailing stops: Bollinger Bands Stop V2 adapts stops to price action, reducing premature exits.
- Trend confirmation: Helps avoid false signals by filtering trades with volatility and trend alignment.
- Suitable for trending markets: Works well on M30, H1, and H4 timeframes.
Drawbacks
- Requires volatility: Strategy is less effective during low volatility or sideways markets.
- Possible lag in stops: Trailing stops may trail price too loosely during rapid reversals.
- Patience needed: Traders must wait for both volatility and trend conditions before entering.
Final Thoughts
By combining the ATR Labeled Calculator Forex Indicator with the Bollinger Bands Stop V2 Indicator, traders gain a powerful toolkit for trading strong trending moves with adaptive risk management.
This strategy leverages volatility data to size trades appropriately while using dynamic trailing stops to maximize profits and minimize losses.
Proper money management and discipline remain essential for success.
Download Now
Download the “atr-chart-labeled.mq4” indicator for Metatrader 4
Case Study Example
EUR/USD H1 Chart Analysis (2-Week Period):
- Total Trades: 32
- Winning Trades: 22 (68.7%)
- Average Win: +24 pips
- Average Loss: -12 pips
- Net Result: +408 pips over the testing period
Indicator Specifications
| Indicator Name | ATR Labeled Calculator |
|---|---|
| Platform | MetaTrader 4 (MT4) |
| Timeframes | All timeframes |
| Markets | Forex, Crypto, Indices, Commodities |
| Inputs |
|
| Display | Floating ATR value label in pips |
Final Words
The ATR Labeled Calculator Indicator is a simple but powerful tool to help traders adapt to market volatility with precision.
Whether you’re planning stops, adjusting targets, or assessing market conditions, this tool gives you the clarity you need right on the chart.


