
About the Indicator
The Accumulative Swing Index (ASI) is a technical indicator designed by Welles Wilder to measure long-term market direction and strength.
It combines price action with momentum and volatility to produce a smooth line that helps detect trend continuation, breakout confirmation, and market reversals.
The ASI is particularly useful in confirming trend strength during sideways or choppy price movements.
Key Features of the ASI Indicator
- Measures market strength using a swing-based formula
- Visually plots directional momentum on a separate chart window
- Helps confirm breakouts and trend direction
- Effective for trend-following and reversal traders
- Works on any MT4 chart and all timeframes
How It Works
The ASI uses open, high, low, and close prices to calculate price swings and accumulates them into a single plotted line.
This line rises or falls depending on the strength and direction of market moves.
When the ASI line moves in the same direction as the price, it confirms the trend.
Divergence between price and ASI can signal weakening momentum or a potential reversal.
Free Download
Download the “accumulative-swing-index.mq4” indicator for MT4
Benefits of Using the Indicator
- Provides early clues about trend reversals or breakout failures
- Confirms trend continuation with consistent directional movement
- Great filter for other momentum or trend indicators
- Works as a confirmation tool for entry and exit decisions
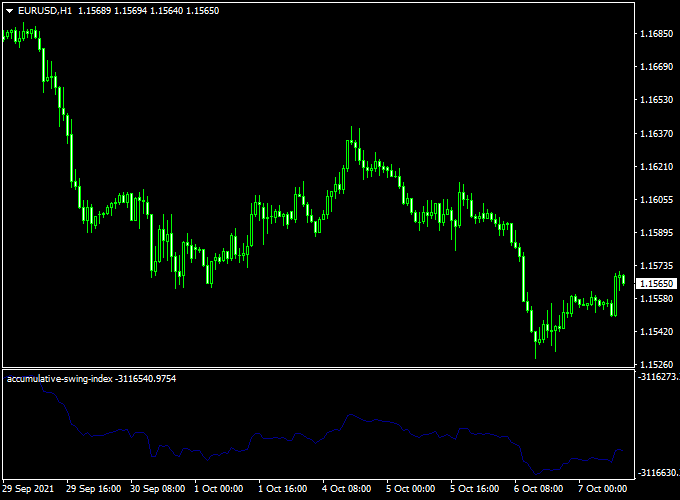
Indicator Example Chart (EUR/USD H1)
How To Trade Using This Indicator
Buy Signal Strategy
- Look for a price break above a recent resistance
- Confirm with ASI moving upward in the same direction
- Set the Stop Loss just below the breakout candle or swing low
- Target recent highs or use a trailing stop as ASI continues to rise
Sell Signal Strategy
- Price breaks below the key support zone
- ASI line slopes downward, confirming bearish momentum
- Place Stop Loss above the recent swing high
- Take profit at support zones or via ASI divergence signal
Divergence Trading
If price makes a new high while ASI fails to follow, it could signal a weakening trend—a setup for a reversal. The same logic applies to bullish divergence.
Download Now
Download the “accumulative-swing-index.mq4” indicator for Metatrader 4
ASI + Hodrick Prescott Channel Forex Strategy for MT4
This forex trading strategy combines the trend-measuring power of the Accumulative Swing Index (ASI) Forex Indicator with the dynamic range-filtering capabilities of the Hodrick Prescott Channel Indicator.
By pairing ASI’s ability to capture true trend strength and direction with the Hodrick Prescott Channel’s smooth cyclical filters, traders can identify breakout and continuation setups with improved clarity and timing.
What Is This Strategy About?
The ASI Indicator is a momentum-based oscillator developed by Welles Wilder.
It calculates swing strength while accounting for open, high, low, and close data.
When combined with the Hodrick Prescott Channel, which draws a statistical regression-style envelope around price movements, the strategy helps traders catch directional breakouts and avoid false moves in ranging markets.
This system works best on H1 and H4 charts and is suitable for both day and swing trading.
Buy Rules
Conditions:
- The ASI line crosses above its zero baseline, indicating bullish momentum.
- The price breaks and closes above the upper Hodrick Prescott Channel band, confirming bullish expansion.
Entry:
Open a buy trade when the ASI moves above 0 and the price closes above the upper channel band of the Hodrick Prescott Indicator.
Stop Loss:
Place your stop below the middle channel line or the most recent swing low, whichever is closer and offers better risk control.
Take Profit:
Use a 1:2 or 1:3 risk-to-reward ratio, or close the trade when ASI starts turning down toward zero or the price re-enters the channel.
Sell Rules
Conditions:
- The ASI line crosses below the zero baseline, signaling bearish momentum.
- The price closes below the lower Hodrick Prescott Channel band, indicating a potential downside breakout.
Entry:
Initiate a short position when the ASI moves below zero and the price breaks beneath the lower band of the Hodrick Prescott Channel.
Stop Loss:
Set the stop loss above the middle channel line or recent swing high.
Take Profit:
Exit at a reward-to-risk ratio of 2:1 or when ASI starts moving back toward the zero line.
Advantages
- Combines trend momentum (ASI) with volatility filtering (Hodrick Prescott).
- Reduces whipsaws by only trading confirmed breakouts.
- Suitable for trend-following and breakout traders.
- Works well during London and New York trading hours.
Drawbacks
- Underperforms in extremely choppy markets with no clear trend.
- May produce fewer signals, requiring trader patience and discipline.
- Hodrick Prescott smoothing can cause delayed channel shifts in fast markets.
Conclusion
The ASI + Hodrick Prescott Channel Strategy is a smart combination for traders looking to catch sustainable moves supported by both trend strength and price structure breakouts.
Use the Accumulative Swing Index to filter momentum direction and the Hodrick Prescott Channel for breakout zones and trade entries.
Together, these indicators provide a powerful framework for disciplined and focused trading in forex markets.
Examples, Case Data, Back Test, Pros & Cons
Pros
- Based on a proven formula by legendary trader Welles Wilder
- Can confirm price action strategies and reduce false signals
- Easy to read and interpret once familiar with the behavior
Cons
- May lag during high volatility moves
- Should not be used standalone for entries
Back Testing Insight
When backtested with trend-following strategies (e.g., EMA crossovers), the ASI improved entry confirmation and reduced whipsaws.
It performs best on higher timeframes (H1 and above) with clean trending conditions.
Indicator Specifications
| Indicator Name | Accumulative Swing Index (ASI) |
|---|---|
| Platform | MetaTrader 4 (MT4) |
| Timeframes | All timeframes |
| Currency Pairs | All pairs supported |
| Type | Momentum / Trend Confirmation |
| Inputs |
|
Final Words
The Accumulative Swing Index is a reliable tool for confirming the direction and strength of market trends.
It offers a valuable edge when used with other technical tools like support/resistance, moving averages, or candlestick patterns.
Whether you’re trading breakouts, reversals, or trend continuations, the ASI helps you stay on the right side of the market.


