
About the Advanced iRSI Histogram Indicator
The Advanced iRSI Histogram Forex Indicator for MetaTrader 4 is a trend-following tool derived from the classic RSI concept.
Instead of showing traditional RSI lines, it converts momentum data into a color-coded histogram that highlights active buy and sell trends directly on the chart.
The indicator uses blue and red histogram bars to represent bullish and bearish market conditions.
A blue histogram signals a buy trend, while a red histogram signals a sell trend.
This visual approach makes trend direction easy to recognize, even for traders with limited experience.
The Advanced iRSI Histogram works well across all currency pairs, including majors and cross pairs.
Many traders combine it with session timing, support and resistance, or fixed profit targets to improve execution and consistency.
Free Download
Download the “iRSI_Advanced_Histo_v1.0.ex4” MT4 indicator
Key Features
- RSI-based histogram trend indicator.
- Blue bars indicate buy trends.
- Red bars indicate sell trends.
- Works on all currency pairs.
- Compatible with all MT4 timeframes.
- Simple signals suitable for beginners.
Indicator Chart
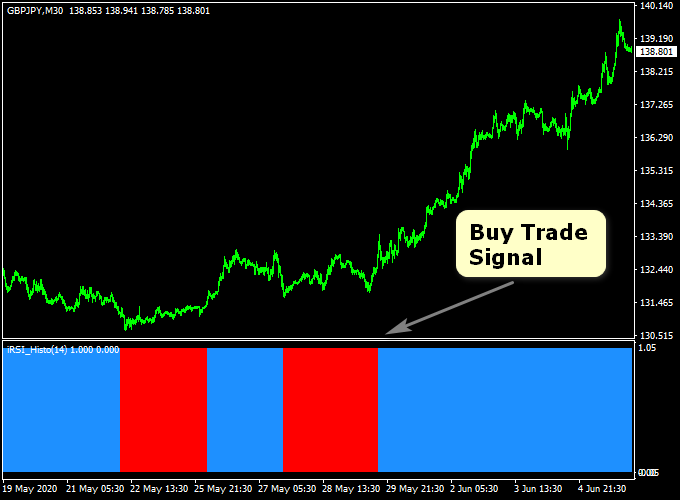
The chart below shows the Advanced iRSI Histogram Indicator applied to a forex chart.
The histogram changes color as trend direction shifts.
Blue bars signal bullish momentum, while red bars indicate bearish momentum.
Traders use the first color change to identify potential trade entries and exits.
Guide to Trade with Advanced iRSI Histogram Indicator
Buy Rules
- The iRSI Histogram prints its first blue bar.
- The market shows bullish momentum.
- The trade is opened at the start of the blue histogram trend.
Sell Rules
- The iRSI Histogram prints its first red bar.
- The market shows bearish momentum.
- The trade is opened at the start of the red histogram trend.
Stop Loss
- Place the stop loss 1 to 3 pips below the previous swing support for buy trades.
- Place the stop loss 1 to 3 pips above the previous swing resistance for sell trades.
- Traders may also apply a personal stop loss method.
Take Profit
- Close the trade when the opposite histogram color appears.
- Use a fixed pip target suited to the timeframe.
- For example, 20 pips on M5 or 50 pips on M30.
Advanced IRSI Histogram + Instant Trend Line MT4 Scalping Strategy
This scalping strategy combines the Advanced IRSI Histogram Forex MT4 Indicator with the Instant Trend Line Scalper Indicator for MT4.
The Advanced IRSI Histogram identifies short-term trends, showing blue bars for bullish momentum and red bars for bearish momentum.
The Instant Trend Line provides precise entry signals when the price crosses above the red trend line for buys and below the line for sells.
This strategy is optimized for M1 and M5 charts, making it ideal for scalpers looking to capture quick price movements in high-liquidity pairs like EURUSD, GBPUSD, and USDJPY.
Buy Entry Rules
- The Advanced IRSI Histogram displays blue bars, indicating a bullish trend.
- Price crosses above the Instant Trend Line, confirming the buy signal.
- Enter a buy trade at the close of the candle where both conditions align.
- Place a stop loss below the recent swing low, typically 5–10 pips on M1 or 10–15 pips on M5 charts.
- Set a take profit of 10–20 pips on M1 or 20–35 pips on M5, or exit when the histogram turns red or price closes back below the trend line.
Sell Entry Rules
- The Advanced IRSI Histogram shows red bars, signaling a bearish trend.
- Price crosses below the Instant Trend Line, confirming the sell signal.
- Enter a sell trade at the close of the candle where both signals occur.
- Place a stop loss above the recent swing high, usually 5–10 pips on M1 or 10–15 pips on M5 charts.
- Take profit at 10–20 pips on M1 or 20–35 pips on M5, or exit when the histogram turns blue or price crosses above the trend line.
Advantages
- Combines trend confirmation with precise entry points, improving scalping accuracy.
- Works on multiple currency pairs with good liquidity.
- Effective on M1 and M5 charts for quick trades in short timeframes.
- Minimal lag allows traders to react quickly to fast-moving markets.
Drawbacks
- M1 charts often have market noise that can trigger premature entries or exits.
- Small targets on scalping trades make spreads and commissions more impactful on net profits.
- Rapid trend reversals may occur without sufficient warning from the indicators.
- Overtrading is a risk if traders try to follow every minor signal on M1 charts.
Case Study 1: EURUSD M1 Trade
During the London session, the IRSI Histogram turned blue, and the price crossed above the Instant Trend Line.
A buy entry at 1.1012 with a 6-pip stop loss moved to 1.1032, capturing 20 pips before the histogram turned red, signaling an exit.
The trade lasted under 10 minutes, demonstrating fast scalping potential on M1 charts.
Case Study 2: GBPUSD M5 Trade
In the New York session, the IRSI Histogram showed red bars while the price crossed below the Instant Trend Line.
A sell trade at 1.2470 with a 12-pip stop loss declined to 1.2435, securing 35 pips within 25 minutes.
The histogram turned blue afterward, prompting a clean exit.
Strategy Tips
- Use high-liquidity pairs such as EURUSD, GBPUSD, and USDJPY for better accuracy.
- Focus on M1 for very quick scalps and M5 for slightly longer intraday trades.
- Check higher timeframes, such as H1, to align with the overall trend for safer entries.
- Use a small position size to manage risk on M1 charts due to noise and rapid price changes.
- Trail stops once the trade moves 50% towards the target to protect profits in volatile conditions.
- Practice patience; only take trades when both the histogram and trend line signals fully align.
Download Now
Download the “iRSI_Advanced_Histo_v1.0.ex4” Metatrader 4 indicator
FAQ
Is the Advanced iRSI Histogram suitable for session-based trading?
Yes, it works very well during the London and US trading sessions, especially for scalping and day trading strategies.
Can the indicator settings be customized?
Yes, traders can adjust the iRSI input settings to match their trading style, market conditions, or preferred level of sensitivity.
Does the indicator lag during fast markets?
Like all RSI-based tools, it reacts to price movement, but the histogram format helps reduce delay by highlighting momentum shifts early.
Summary
The Advanced iRSI Histogram Indicator for MT4 offers a practical way to trade momentum using simple color-based signals.
Its clear buy and sell trends make it easy to follow, even for less experienced traders.
With flexibility across timeframes and currency pairs, the indicator fits multiple trading styles.
When combined with disciplined risk management and session awareness, it can become a reliable component of a structured trading approach.


