
About the Awesome Support Resistance Indicator
The Awesome Support Resistance indicator for MetaTrader 4 is designed to automatically identify the most important support and resistance levels on the price chart.
It helps traders focus on areas where price has historically reacted, stalled, or reversed.
The indicator plots horizontal levels directly on the chart using color-coded lines.
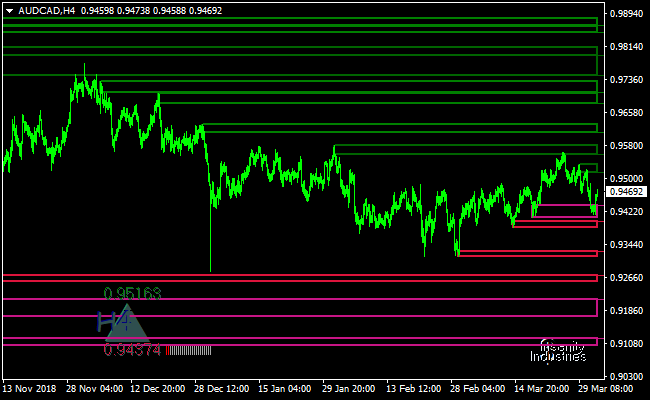
Green lines represent resistance zones where selling pressure has appeared in the past, while red lines mark support zones where buying interest has been stronger.
Each level is accompanied by its exact price value.
This indicator works well for breakout trading, trend continuation setups, and general market analysis.
It can be used on its own or combined with trend-following tools to confirm direction.
Input values and color settings can be adjusted to match different trading styles and chart preferences.
Free Download
Download the “awesome_SupDem.ex4” MT4 indicator
Key Features
- Automatically identifies key support and resistance levels.
- Green lines mark resistance zones.
- Red lines mark support zones.
- Exact price levels are displayed on the chart.
- Works on all timeframes and currency pairs.
- Useful for breakout and trend-based strategies.
- Customizable inputs and color options.
Indicator Chart
This chart example shows the Awesome Support Resistance indicator applied to the price chart.
Multiple horizontal levels highlight important support and resistance zones, allowing traders to monitor potential breakout areas and reaction points.
Guide to Trade with Awesome Support Resistance Indicator
Buy Rules
- Identify a clearly defined resistance level marked by a green line.
- Wait for the price to break and close above the resistance level.
- Confirm that the broader market trend is bullish.
- Open a buy trade after the breakout candle closes.
Sell Rules
- Identify a clearly defined support level marked by a red line.
- Wait for the price to break and close below the support level.
- Confirm that the broader market trend is bearish.
- Open a sell trade after the breakout candle closes.
Stop Loss
- For buy trades, place the stop loss below the nearest red support level.
- For sell trades, place the stop loss above the nearest green resistance level.
- Allow some buffer beyond the level to avoid premature exits.
Take Profit
- Set take profit near the next resistance level for buy trades.
- Set take profit near the next support level for sell trades.
- Trail partial profits as new levels form.
Awesome Support Resistance + XHMaster Formula MT4 Strategy
This MT4 trading strategy combines two powerful tools to help you trade with structure and confirmation.
The Awesome Support Resistance Indicator marks key support and resistance zones on the chart. Green levels show resistance, and red levels show support.
The second tool is the XHMaster Formula Indicator.
This indicator provides directional confirmation. A green line signals a buy trend and a red line signals a sell trend.
Together, they form a clean structure-based strategy that works for scalping, day trading, and swing trading.
You can use it on M5, M15, H1, or H4, depending on your trading style.
The signals are simple, and the rules remain clear even in higher volatility.
Buy Entry Rules
- Price must bounce from a red support level drawn by the Awesome Support Resistance Indicator.
- The XHMaster Formula Indicator must turn green.
- Enter a buy trade when the candle closes above support with the XHMaster line fully green.
- Place your stop loss a few pips below the support level.
- Set take profit at the next green resistance level.
- You may extend the target if momentum is strong and the price breaks through resistance.
Sell Entry Rules
- Price must reject a green resistance level drawn by the Awesome Support Resistance Indicator.
- The XHMaster Formula Indicator must turn red.
- Enter a sell trade when the candle closes below the resistance rejection area with the XHMaster line fully red.
- Place your stop loss a few pips above the resistance.
- Set take profit at the next red support level.
- You may extend the target if the price continues with strong downside pressure.
Advantages
- Clear structure from support and resistance levels.
- Strong trend confirmation from the XHMaster Formula.
- Easy to use, even for beginners.
- Works across different market conditions.
- It can be used for short-term and long-term trades.
Drawbacks
- Ranging markets may produce false signals.
- Support and resistance levels can shift during high volatility.
- Trades may trigger late during news releases.
- Best results require patience and waiting for a clean confirmation.
Case Study 1
On EURUSD M15, the market formed a red support zone around 1.0710. Price tested the level twice and failed to break lower.
The XHMaster Formula line turned green right after the second test. A buy trade was triggered on the candle close above support.
The stop loss was placed below 1.0705.
Price moved cleanly upward and reached the next green resistance zone near 1.0740.
The move produced about 30 pips with low drawdown.
Case Study 2
On GBPUSD H1, a clear resistance zone formed at 1.2920. Price rejected it three times and created long wicks.
The XHMaster Formula line switched to red and showed a clear downward slope.
A sell trade was taken at the close below the rejection area.
Stop loss was placed above 1.2930.
Price moved steadily down to the next red support zone near 1.2860.
The trade delivered around 60 pips.
Strategy Tips
- Wait for clean touches of support and resistance levels before acting. Levels must show real reactions.
- Use the XHMaster Formula only as confirmation. Never trade against its color.
- Try to trade in sessions with higher liquidity, such as London and New York.
- Always avoid major news releases if the market is unstable.
- Trail your stop once the price moves halfway to your target.
- Take only high-quality signals with clean candle closes.
Download Now
Download the “awesome_SupDem.ex4” Metatrader 4 indicator
FAQ
How are the support and resistance levels calculated?
The indicator analyzes historical price reactions to determine areas where buying or selling pressure has been strongest.
Can this indicator be used for breakout trading?
Yes. It is particularly useful for identifying breakouts above resistance or below support.
Does the indicator update levels automatically?
Yes. Levels adjust as new price data becomes available.
Is it suitable for lower timeframes?
It can be used on lower timeframes, but higher charts often provide more reliable levels.
Summary
The Awesome Support Resistance MT4 indicator gives traders a reliable way to visualize key price levels that influence market behavior.
Its clear on-chart display helps simplify decision-making during fast-moving markets.
By combining breakout logic with disciplined stop placement, the indicator fits a wide range of trading strategies.
Fine-tuning its settings and pairing it with trend confirmation tools can further improve overall trading performance.


