About the CCI Divergence Indicator
The CCI Divergence Indicator for MT4 is a powerful technical tool designed to spot discrepancies between price action and the Commodity Channel Index.
Divergence occurs when the price makes a new high or low that is not confirmed by the oscillator, often signaling that the prevailing trend is losing momentum and a reversal is imminent.
This indicator automates the detection process by scanning the charts and placing visual markers exactly where these shifts occur.
It saves traders from the tedious task of manually drawing lines and comparing peaks, making it a highly efficient solution for reversal-based strategies.
By focusing on the momentum behind price movements, the CCI Divergence Indicator provides an early warning system for potential market turns.
It is particularly useful in identifying exhausted trends that are about to snap back, allowing you to enter trades at the very beginning of a new move.
Free Download
Download the “cci-divergence.ex4” MT4 indicator
Key Features
- Automatically identifies and plots bullish and bearish divergences on the price chart.
- Uses color-coded arrows to signify potential entry points for buy and sell trades.
- Includes an adjustable CCI period setting to fine-tune sensitivity for various strategies.
- Works across all timeframes, from one-minute scalping to weekly swing trading.
- Helps filter out weak trend continuations by focusing on momentum exhaustion.
- Integrates easily with other technical analysis tools for a more complete trading system.
Indicator Chart
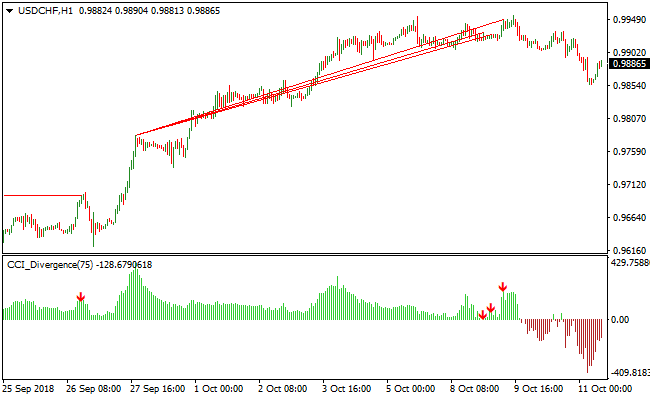
The CCI Divergence Indicator displays directly on the MT4 main window and the indicator sub-window.
A green CCI divergence arrow appears when the price makes a lower low but the oscillator makes a higher low, suggesting a bullish reversal.
Conversely, a red CCI divergence arrow highlights a bearish reversal where the price makes a higher high while the oscillator makes a lower high.

Guide to Trade with CCI Divergence Indicator
Buy Rules
- Monitor the chart for the appearance of a green CCI divergence arrow.
- Verify that the price has recently touched or broken a major support level.
- Check the CCI window to ensure the bullish divergence is clearly visible and rising.
- Open a long position once the candle associated with the green arrow closes.
Sell Rules
- Look for a red CCI divergence arrow to appear above a price peak.
- Confirm that the signal occurs near a significant resistance zone or supply area.
- Observe the oscillator to ensure the bearish divergence shows a clear downward slope.
- Execute a short trade after the candle close to avoid entering on a false signal.
Stop Loss
- For buy trades, place the stop loss a few pips below the most recent swing low.
- For sell trades, position the stop loss just above the recent swing high.
- Adjust the stop distance based on the timeframe to ensure the trade has room to breathe.
Take Profit
- Set the take profit target at the next major support or resistance level.
- Consider a risk to reward ratio of at least 1:1.5 for consistent long-term results.
- Close the trade early if an opposing divergence arrow appears on the chart.
CCI Divergence Indicator + Ultimate Moving Average Forex Strategy for MT4
This MT4 strategy combines the CCI Divergence Indicator with the Ultimate Moving Average Indicator to create a reliable trend-following forex strategy.
The CCI Divergence Indicator identifies potential reversals with green divergence arrows for buy signals and red divergence arrows for sell signals.
The Ultimate Moving Average confirms the overall trend direction: when the price is above the MA, the trend is bullish; when below, the trend is bearish.
By combining reversal signals with trend confirmation, traders can enter high-probability trades in the direction of the dominant trend.
Buy Entry Rules
- Ensure the price is positioned above the Ultimate Moving Average to confirm a bullish trend.
- Wait for a green divergence arrow to appear on the CCI Divergence Indicator.
- Open a buy position at the close of the candle that forms the green divergence arrow.
- Set the stop loss just below the most recent swing low or a nearby support level.
- Close the trade when a red divergence arrow appears or if the price closes below the Ultimate Moving Average, signaling a potential trend reversal.
Sell Entry Rules
- Ensure the price is positioned below the Ultimate Moving Average to confirm a bearish trend.
- Wait for a red divergence arrow to appear on the CCI Divergence Indicator.
- Open a sell position at the close of the candle that forms the red divergence arrow.
- Set the stop loss just above the most recent swing high or a nearby resistance level.
- Close the trade when a green divergence arrow appears or if the price closes above the Ultimate Moving Average, signaling a potential trend reversal.
Advantages
- Combining divergence signals with trend confirmation increases trade accuracy.
- Works on multiple timeframes and currency pairs, making it versatile for different trading styles.
- Allows traders to capture trend continuation after a reversal signal.
- Dynamic take profit based on divergence or MA reversal helps lock in profits efficiently.
- Can be combined with support and resistance levels for stronger entries.
Drawbacks
- Requires monitoring of both indicators for accurate entries and exits.
- Lower timeframes may have more noise, leading to quicker stop-outs.
- Traders must be disciplined in waiting for proper confirmation from both indicators before entering a trade.
Example Case Study 1 – EUR/USD M15
During the London session, EUR/USD was above the Ultimate Moving Average, indicating a bullish trend.
A green divergence arrow appeared at 1.0875.
A buy trade was entered at 1.0875 with a stop loss at 1.0865.
Price moved upward and the trade was closed at 1.0890 when a red divergence arrow appeared, capturing 15 pips.
Example Case Study 2 – GBP/JPY M30
GBP/JPY on the M30 chart during the New York session was below the Ultimate Moving Average, indicating a bearish trend.
A red divergence arrow appeared at 152.35.
A sell trade was entered at 152.35 with a stop loss at 152.50.
Price moved downward and the trade was closed at 152.10 when a green divergence arrow appeared, capturing 25 pips.
Strategy Tips
- Focus on higher-probability trades where the divergence arrow aligns with a strong MA trend.
- Use this strategy on liquid pairs to reduce slippage and improve execution.
- Consider using additional confirmation from candlestick patterns to strengthen entries.
- Be patient and wait for clear divergence signals aligned with the trend instead of trading every signal.
- Adjust stop loss and take profit levels dynamically according to recent market swings rather than fixed pip targets.
Download Now
Download the “cci-divergence.ex4” Metatrader 4 indicator
FAQ
What is the difference between regular and hidden divergence in this tool?
The CCI Divergence Indicator primarily focuses on regular divergence, which is a classic reversal signal.
Regular bullish divergence happens at price bottoms, while regular bearish divergence happens at price tops.
This tool simplifies the process by highlighting these specific moments where price and momentum are no longer in sync, suggesting the current trend is about to end.
Can I change the sensitivity of the divergence signals?
Yes, you can modify the CCI period in the inputs tab.
A lower period like 14 will make the indicator more sensitive and produce more signals, which is often preferred by scalpers.
A higher period like 50 will produce fewer but more significant signals, which is generally better for traders who prefer higher timeframes like the H4 or Daily.
Summary
The CCI Divergence Indicator is a practical addition to any trader’s toolkit because it highlights high-probability reversal zones that are often missed.
Automating the identification of price and momentum discrepancies allows for faster decision-making and better entry timing.
Its ability to work across all timeframes makes it a versatile tool for various trading styles.
Using this tool to spot exhaustion in the market can give you a significant edge over those only looking at price.


