
About the CCI Histogram Indicator
The CCI Histogram indicator for MT4 displays Commodity Channel Index (CCI) signals in a simple, easy-to-read histogram panel.
It uses color coding to indicate market momentum: blue for bullish trends, red for bearish trends, and gray for flat or consolidating conditions.
A trend is considered bullish when the histogram stays above zero, and bearish when it stays below zero.
Traders can combine the histogram with a trend-following tool, such as a 200-period simple moving average or a 100-period exponential moving average, to filter signals.
The default CCI period is set to 50 but can be adjusted in the inputs menu.
The indicator works well for scalping, intraday, and short-term trend trading by allowing traders to act in the direction of underlying momentum while ignoring countertrend signals.
Free Download
Download the “cci-histogram.ex4” MT4 indicator
Key Features
- Color-coded histogram to display bullish (blue), bearish (red), and neutral (gray) trends.
- Easy-to-read separate window for fast visual analysis of CCI signals.
- Works well with trend-following indicators to reduce false signals.
- Adjustable CCI period to match trading style and timeframe.
- Supports scalping, intraday, and short-term trend trading strategies.
Indicator Chart
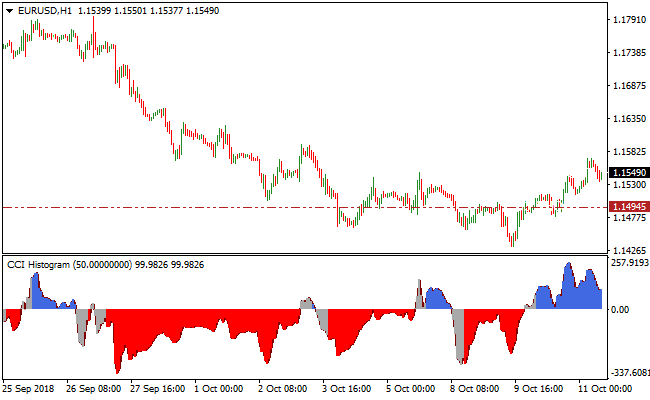
The image below shows the CCI Histogram displayed in a separate window under the main price chart.
Blue bars indicate bullish momentum, red bars indicate bearish momentum, and gray bars indicate sideways or flat market conditions.
Forex traders can use these histogram signals to align entries with the main trend and improve timing.
Guide to Trade with the CCI Histogram Indicator
Buy Rules
- Confirm the overall trend is upward using a trend-following tool.
- Enter a buy trade when the histogram turns blue and moves above the zero line.
- Ensure momentum is increasing rather than stalling near zero.
- Avoid buy trades when the histogram is gray or declining toward zero.
Sell Rules
- Confirm the overall trend is downward using a trend-following tool.
- Enter a sell trade when the histogram turns red and moves below the zero line.
- Ensure bearish momentum is strong and not flattening near zero.
- Avoid sell trades when the histogram is gray or rising toward zero.
Stop Loss
- For buy trades, place the stop-loss slightly below the most recent swing low or below the lower boundary of the histogram bars.
- For sell trades, place the stop-loss slightly above the most recent swing high or above the upper boundary of the histogram bars.
- Consider trailing the stop-loss along the histogram’s color changes to lock in profits.
Take Profit
- Close buy trades if the histogram turns red or approaches the zero line.
- Close sell trades if the histogram turns blue or approaches the zero line.
- Optionally, secure partial profits at recent support for buys or resistance for sells.
- Exit early if momentum slows or the histogram shows mixed colors.
CCI Histogram Indicator + Algorithmic MegaTrend Forex Strategy
This MT4 strategy combines the CCI Histogram Indicator with the Algorithmic MegaTrend Indicator to create a trend-following forex strategy.
The CCI Histogram provides visual buy and sell signals: blue bars indicate bullish momentum and red bars indicate bearish momentum.
The Algorithmic MegaTrend indicator confirms the overall trend using the same color system: blue histogram bars indicate an uptrend and red histogram bars indicate a downtrend.
By combining the two indicators, traders can enter trades with high probability in the direction of the dominant trend.
This strategy works well on major currency pairs such as EUR/USD, GBP/USD, USD/JPY, and AUD/USD, and is suitable for M15, M30, and H1 charts.
Buy Entry Rules
- The Algorithmic MegaTrend histogram must be blue, indicating a bullish trend.
- The CCI Histogram shows a blue bar, confirming buy momentum.
- Enter a buy trade at the close of the confirming candle.
- Place stop loss below the most recent swing low or nearby support level.
- Take profit when the CCI Histogram turns red or when the Algorithmic MegaTrend histogram shows weakening momentum.
Sell Entry Rules
- The Algorithmic MegaTrend histogram must be red, indicating a bearish trend.
- The CCI Histogram shows a red bar, confirming sell momentum.
- Enter a sell trade at the close of the confirming candle.
- Place a stop loss above the most recent swing high or nearby resistance level.
- Take profit when the CCI Histogram turns blue or when the Algorithmic MegaTrend histogram shows weakening momentum.
Advantages
- Helps traders capture both trend direction and momentum for higher-probability trades.
- Flexible strategy suitable for multiple timeframes and trading styles, including day trading and swing trading.
- Reduces emotional trading by relying on objective signals from indicators.
- Allows traders to enter trades early in trend continuation moves for maximum potential profit.
- Can be combined with other confirmation tools, such as support and resistance, for stronger setups.
Drawbacks
- In flat or ranging markets, signals can become less reliable and may generate frequent false entries.
- Lower timeframes like M5 may produce more noise and require quick decision-making.
- Traders may experience small losses if momentum reverses sharply after entry.
- Requires careful monitoring of both indicators to avoid conflicting signals.
- May not perform well during sudden news events or unexpected market shocks.
Example Case Study 1 – EUR/USD M15
During the London session, EUR/USD showed a blue Algorithmic MegaTrend histogram, indicating an uptrend.
The CCI Histogram displayed a blue bar at 1.0875.
A buy trade was entered at 1.0875 with a stop loss at 1.0865 below the recent swing low.
Price moved upward and the trade was closed at 1.0890 when the CCI Histogram turned red, capturing 15 pips.
The Algorithmic MegaTrend remained blue throughout the trade, confirming the bullish trend.
Example Case Study 2 – GBP/JPY M30
GBP/JPY on the M30 chart during the New York session showed a red Algorithmic MegaTrend histogram, indicating a downtrend.
The CCI Histogram displayed a red bar at 152.35.
A sell trade was entered at 152.35 with a stop loss at 152.50 above the recent swing high.
Price dropped and the trade was closed at 152.10 when the CCI Histogram turned blue, capturing 25 pips.
Strategy Tips
- Use major pairs with high liquidity for smoother trade execution.
- Focus on M15, M30, and H1 charts for more reliable signals.
- Do not enter trades if the CCI Histogram signal conflicts with the Algorithmic MegaTrend trend.
- Take profits dynamically based on histogram color changes rather than fixed pip targets.
- Maintain a trade journal to track pairs, sessions, and performance for continuous improvement.
Download Now
Download the “cci-histogram.ex4” Metatrader 4 indicator
FAQ
Can the CCI period be adjusted?
Yes, the default period is 50, but you can modify it in the inputs menu to suit different currency pairs, timeframes, and trading styles.
What do the histogram colors represent?
Blue bars indicate bullish momentum, red bars indicate bearish momentum, and gray bars indicate a flat or range-bound market. Use these colors to align entries with trend strength.
Summary
The CCI Histogram indicator simplifies CCI signals by presenting them in a color-coded histogram window, making it easy to identify short-term bullish and bearish momentum.
Used together with a trend-following indicator, it helps traders focus on high-probability trades, manage risk effectively, and avoid countertrend entries.
The histogram provides a clear visual guide for scalping, intraday, and short-term trend trading.


