About the Center of Gravity v3 Indicator
The Center of Gravity v3 indicator for MT4 is a momentum and retracement tool that helps traders identify potential entry points based on overbought and oversold conditions.
It consists of a central line representing the equilibrium price and multiple bands that signal extremes.
Green bands indicate oversold conditions, suggesting price may bounce upward toward the center.
Red bands indicate overbought conditions, suggesting price may pull back toward the center.
Traders can use this to catch retracements while remaining aligned with the overall trend.
Its design emphasizes simplicity, showing traders when price is stretched and likely to revert to a mean, which makes timing entries more precise.
Free Download
Download the “Center of Gravity v 3.mq4” MT4 indicator
Key Features
- Shows central equilibrium line for price.
- Green bands signal oversold conditions.
- Red bands signal overbought conditions.
- Helps traders anticipate price retracements.
Indicator Chart
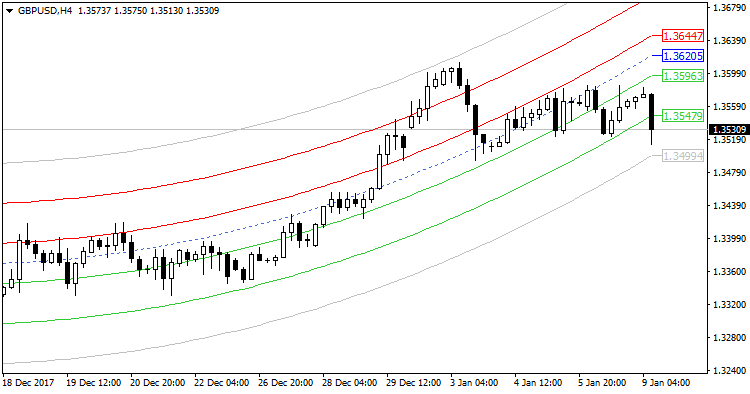
The chart shows the Center of Gravity v3 indicator beneath the main price area.
Green bands highlight oversold zones, red bands show overbought zones, and the center line marks the equilibrium price.
Traders use these signals to time entries during retracements in the direction of the prevailing trend.

Guide to Trade with Center of Gravity v3
Buy Rules
- Confirm the lines are pointing upward, signaling an uptrend.
- Enter a buy trade when price touches the green oversold bands.
- Wait for confirmation that the oversold zone is holding.
- Focus on entries that align with the trend direction.
Sell Rules
- Confirm the lines are pointing downward, signaling a downtrend.
- Enter a sell trade when price touches the red overbought bands.
- Wait for confirmation that the overbought zone is resisting.
- Trade only in the direction of the downtrend.
Stop Loss
- For buy trades, place the stop loss just below the most recent swing low or support level.
- For sell trades, place the stop loss just above the most recent swing high or resistance level.
- Move the stop to break-even once the price retraces halfway to the center line.
Take Profit
- Target the center line of the indicator for initial profit.
- Partial exit can be taken if price moves strongly past the center line.
- Hold trades longer if the trend remains strong and momentum continues.
- Exit fully if price reaches the opposite overbought/oversold band.
Center of Gravity V3 and Trend Magic Indicator Forex Strategy
This MT4 strategy combines trend direction with entry signals using the Center of Gravity V3 Indicator and the Trend Magic Indicator.
The Center of Gravity V3 shows trend direction, where upward-pointing lines indicate a bullish trend and downward-pointing lines indicate a bearish trend.
The Trend Magic indicator adds precise entries with a blue line for buy signals and a red line for sell signals.
Combining both indicators ensures trades are taken only in the direction of the trend, making it effective for M5 and M15 intraday trading.
Buy Entry Rules
- Ensure the Center of Gravity V3 lines are pointing up, confirming an upward trend.
- Wait for a blue line from the Trend Magic indicator to appear.
- Enter a buy trade at the close of the candle when the blue line appears.
- Place a stop loss below the recent swing low or the nearest support level.
- Take profit when the Trend Magic line turns red or the Center of Gravity lines start to turn down.
Sell Entry Rules
- Ensure the Center of Gravity V3 lines are pointing down, confirming a downward trend.
- Wait for a red line from the Trend Magic indicator to appear.
- Enter a sell trade at the close of the candle when the red line appears.
- Place a stop loss above the recent swing high or the nearest resistance level.
- Take profit when the Trend Magic line turns blue or the Center of Gravity lines start to turn up.
Advantages
- Aligns trades with the main trend, reducing the risk of countertrend entries.
- Provides clear entry and exit signals using Trend Magic lines.
- Simplifies decision-making by combining trend direction with momentum-based entries.
- Effective for both M5 and M15 intraday trading.
- Easy to apply across multiple currency pairs without adjustment.
- Helps traders maintain discipline and follow a structured strategy.
Drawbacks
- May produce delayed signals in rapidly changing markets.
- False Trend Magic lines can occur during sideways or low volatility conditions.
- Partial profits may be missed if the trend reverses before target levels are reached.
- Low liquidity pairs may experience slippage, affecting trade performance.
Example Case Study 1
On EURUSD M5, the Center of Gravity V3 lines were pointing up, confirming an upward trend.
A blue line appeared from the Trend Magic indicator.
A buy trade was entered at candle close with a stop loss placed 3 pips below the recent swing low.
Price moved steadily upward, and the trade was closed when the Trend Magic line turned red, gaining a 26 pip gain.
Trend alignment ensured a high-probability entry.
Example Case Study 2
On AUDJPY M15, the Center of Gravity V3 lines were pointing down, indicating a bearish trend.
A red line appeared on the Trend Magic indicator.
A sell trade was entered at candle close with a stop loss set 5 pips above the recent swing high.
Price declined and the trade was closed when the Trend Magic line turned blue, resulting in a 33 pip profit.
Using both trend and signal confirmation helped capture the main move without trading against the trend.
Strategy Tips
- Combine signals with higher timeframe trend confirmation to improve accuracy.
- Use support and resistance levels to refine entries and exits.
- Monitor price action around major news events and avoid taking trades during high volatility spikes.
- Consider using trailing stops to lock in profits while allowing trends to run.
- Focus on trading during active market sessions for better liquidity and faster execution.
- Skip trades if the Trend Magic line appears but the trend is weak or uncertain.
- Adjust stop loss dynamically based on recent swings rather than fixed pip distances.
Download Now
Download the “Center of Gravity v 3.mq4” Metatrader 4 indicator
FAQ
How does the Center of Gravity line work?
The center line represents the mean equilibrium price. Price often retraces to this line from overbought or oversold extremes.
Can I trade against the trend using this indicator?
It is recommended to follow the trend indicated by the slope of the lines. Trading against the trend increases risk.
Do the bands repaint?
The indicator is calculated in real time and may adjust slightly as new price data comes in, but it primarily reflects current market extremes.
Summary
The Center of Gravity v3 indicator offers a simple and effective way to identify price retracements within a trend.
By highlighting overbought and oversold zones relative to a central equilibrium line, it helps traders anticipate potential reversals and time entries.
Its flexibility across timeframes and trading styles makes it a versatile tool for MT4 users looking to combine trend direction with mean-reversion strategies.


