
About the Indicator
The Chart Forex Indicator for MetaTrader 4 (MT4) offers a simplified and smoothed representation of candlestick charts.
By filtering out market noise, it provides traders with a clearer overview of prevailing trends, aiding in more informed decision-making.
Key Features
- Simplified candlestick visualization for clearer trend analysis.
- Customizable color settings and styles to suit individual preferences.
- Compatible with all currency pairs and timeframes.
- Lightweight design ensures minimal impact on platform performance.
Free Download
Download the “chart.ex4” indicator for MT4
Benefits of Using the Indicator
- Enhances clarity by reducing chart clutter.
- Assists in identifying dominant market trends more easily.
- Improves trading decisions by providing a cleaner visual representation.
- Ideal for both novice and experienced traders seeking a straightforward charting tool.
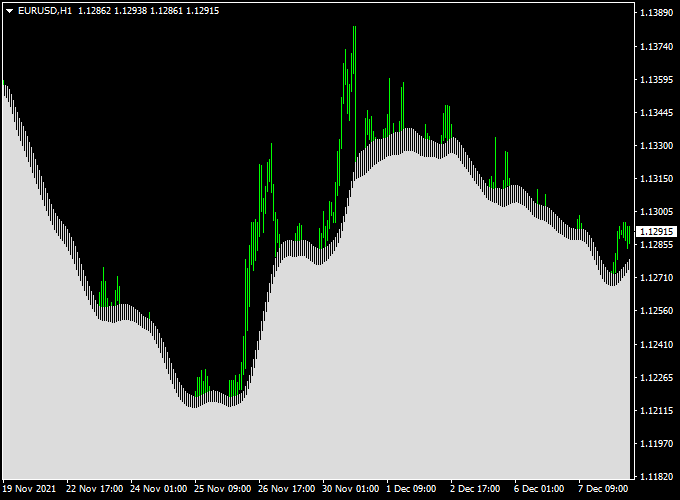
Indicator Example Chart (EUR/USD H1)
Below is an example of the Chart Forex Indicator applied to the EUR/USD H1 chart,
How to Trade Using This Indicator
Utilize the Chart Forex Indicator to identify prevailing trends and potential reversal points.
Combine its signals with other technical analysis tools to enhance trade accuracy.
Entry Signals
- Enter a buy position when the indicator shows a consistent upward trend.
- Enter a sell position when the indicator displays a consistent downward trend.
Stop Loss and Take Profit
- Stop Loss: Place below the recent swing low for buy positions and above the recent swing high for sell positions.
- Take Profit: Set at key support or resistance levels identified through additional analysis.
Pros
- Provides a clearer view of market trends by simplifying candlestick patterns.
- Customizable settings allow for personalization to individual trading styles.
- Compatible with all currency pairs and timeframes, offering versatility.
- Lightweight design ensures smooth platform performance.
Download Now
Download the “chart.ex4” indicator for Metatrader 4
MT4 Chart Forex Scalping Strategy: Combining Chart Forex Indicator with X Points Forex Scalper Indicator
This strategy integrates the Chart Forex Indicator with the X Points Forex Scalper Indicator to identify high-probability trading opportunities.
The Chart Forex Indicator provides a smoothed and simplified candlestick chart, offering a clearer overview of the overall trend.
The X Points Forex Scalper Indicator generates precise buy and sell signals, aiding traders in making informed decisions.
Buy and Sell Rules
Buy Setup
- Wait for a blue upward arrow signal from the X Points Forex Scalper Indicator.
- Confirm the Chart Forex Indicator shows a bullish trend.
- Enter a buy trade at the close of the signal candle.
- Place a stop loss below the recent swing low.
- Set take profit at a risk-reward ratio of 1:2 or near the next significant resistance level.
Sell Setup
- Wait for a red downward arrow signal from the X Points Forex Scalper Indicator.
- Confirm the Chart Forex Indicator shows a bearish trend.
- Enter a sell trade at the close of the signal candle.
- Place a stop loss above the recent swing high.
- Set take profit at a risk-reward ratio of 1:2 or near the next significant support level.
Trader Case Studies
Below are examples of traders who applied this strategy to different currency pairs and timeframes, demonstrating its effectiveness in various market conditions.
Ella P – Canada
Ella P, a part-time trader from Canada, used this strategy on the USD/CAD and EUR/USD pairs over 28 days. By carefully following the indicator signals, she earned a total of +290 pips. Ella found that the smoothed chart made trend recognition easier, while the scalper signals helped time entries accurately.
Kofi B – Ghana
Kofi B, a swing trader from Ghana, applied the strategy on GBP/USD and USD/JPY pairs with a 15-minute timeframe. Over 35 days, he gained +365 pips. Kofi noted that the combination helped filter out noise in volatile sessions.
Disclaimer: These case studies are for educational purposes only. Trading results will vary depending on market conditions, risk management, and individual discipline.
Advantages of This Strategy
- Combines trend analysis with precise entry signals for higher accuracy.
- Works well across various timeframes and currency pairs.
- Simplifies decision-making by providing clear buy and sell cues.
- Suitable for both novice and experienced traders.
Drawbacks and Considerations
- Requires discipline to wait for both indicators to confirm before trading.
- May perform poorly during sideways or highly volatile markets.
- Effective risk management is necessary to limit losses.
- May require frequent chart monitoring depending on the chosen timeframe.
Strategy Conclusion and Tips
This combined strategy offers a clear and effective method for scalping by integrating trend filtering with timely entry signals.
Traders should practice patience, ensuring both indicators align before entering trades, and always apply proper risk management.
Testing this strategy on demo accounts is recommended to build confidence before live trading.
Adaptability and continued learning will improve results over time.
Indicator Specifications
| Specification | Details |
|---|---|
| Platform | MetaTrader 4 (MT4) |
| Compatibility | All MT4 brokers |
| Timeframes | M1 to MN (recommended H1/H4 for swing trading) |
| Inputs |
|
| License | Free for personal use |
FAQ
Q: Can I use this indicator for automated trading?
A: The Chart Forex Indicator is designed for manual chart analysis and does not support automated trading features.
Q: Which currency pairs and timeframes work best?
A: The indicator is versatile and can be applied to any currency pair and timeframe, though it is particularly effective on H1 and H4 charts for swing trading.
Q: How do I adjust the indicator for different market conditions?
A: You can modify the color settings and style options through the indicator’s input parameters to suit varying market conditions and personal preferences.
Final Words
The Chart Forex Indicator for MT4 is a valuable tool for traders seeking a simplified view of market trends.
Enhancing chart readability aids in making more informed trading decisions.
Download it for free and integrate it into your trading strategy to improve your market analysis.


