About the Check Mark Pattern at Stochastic (MT4)
The Check Mark Pattern at Stochastic indicator for MT4 highlights a distinctive “✓” swing pattern that forms when momentum shifts out of overbought/oversold zones on the Stochastic Oscillator.
It simplifies timing by marking potential reversal or continuation points directly on the chart, so you can focus on high-quality entries instead of scanning every wave by eye.
Buy & sell signal
- Go long whenever the indicator readings are oversold and the overall trend is upwards.
- Go short whenever the indicator readings are overbought and the overall trend is downwards.
Key Features
- Pattern Detection: Flags “check mark” turns as Stochastic exits extreme zones.
- On-Chart Signals: Clean arrows/labels at the exact bar the pattern confirms.
- Multi-Timeframe Friendly: Works from M1 to D1 without recalibration.
- Alert Suite: Popup, sound, email, and push notifications (optional).
- Custom Thresholds: Set your own overbought/oversold bands and smoothing.
- Non-Intrusive: Minimalist visuals that don’t clutter price action.
Free Download
Download the “checkmarkpattern-at-stochastic.mq4” indicator for MT4
Benefits of Using This Indicator
- Sharper Timing: Catch momentum pivots at logical spots (80/20 or custom zones).
- Rule-Based Entries: Reduce guesswork with pre-defined stochastic structures.
- Fewer False Starts: Wait for confirmation as the oscillator hooks and exits extremes.
- Faster Execution: Alerts bring the setup to you; no constant screen watching is needed.
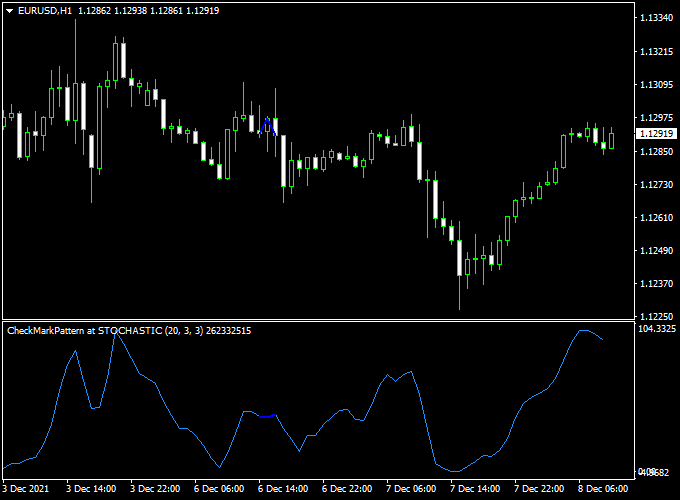
Indicator Example Chart (EUR/USD H1)
Below is a sample view showing how the indicator marks a bullish check mark as Stochastic rises from oversold territory, and a bearish check mark as it rolls over from overbought:

How To Trade Using This Indicator
Market & Timeframe
Forex majors and indices on M5–H1 for intraday; H1–H4 for swing trading.
Confluence (Recommended)
- Trend filter: 50/200 EMA or structure highs/lows.
- Level filter: daily/weekly S&R, round numbers, or VWAP.
- Session filter: focus on liquid sessions (e.g., London/NY overlap).
Entry Rules
Buy Setup
- Trend bias up (price above EMA 200 or higher-high structure).
- Stochastic was below your oversold level (e.g., 20) and prints a bullish check mark (hook up + exit).
- Entry: Buy at candle close of the signal bar or on a small pullback to its 50% level.
Sell Setup
- Trend bias down (price below EMA 200 or lower-low structure).
- Stochastic was above your overbought level (e.g., 80) and prints a bearish check mark (hook down + exit).
- Entry: Sell at candle close of the signal bar or on a small pullback to its 50% level.
Stop Loss & Take Profit
- Stop Loss (SL): Beyond the signal swing:
- Buys: below the signal bar’s low or recent swing low.
- Sells: above the signal bar’s high or recent swing high.
- Take Profit (TP):
- Conservative: 1.5R–2R (risk multiples).
- Aggressive: trail under/over swing structure or use a fixed target at next S&R.
- Trade Management: Consider partials at 1R and move SL to breakeven.
Example Playbook
- Scalp (M5): EMA 200 up, bullish check mark from <20, SL under signal low, TP at 1.8R.
- Intraday (M15–M30): Use session highs/lows; target next intraday level or 2R.
- Swing (H1–H4): Align with HTF trend; aim for prior swing high/low or 2–3R.
Download Now
Download the “checkmarkpattern-at-stochastic.mq4” indicator for Metatrader 4
Check Mark Pattern at Stochastic & Wolfe Wave MT4 Strategy: Precision Reversal Trading
This strategy combines the Check Mark Pattern at Stochastic Forex Indicator with the Wolfe Wave Forex Indicator to identify high-probability market reversal points.
The Check Mark Pattern at Stochastic indicator provides overbought and oversold signals based on the Stochastic oscillator, while the Wolfe Wave Forex Indicator identifies potential market reversals through geometric wave patterns, aiding traders in making informed decisions.
Buy and Sell Rules
Buy Setup
- Wait for the Check Mark Pattern at the Stochastic indicator to display an oversold signal (below 20).
- Ensure the Wolfe Wave Forex Indicator shows a valid bullish Wolfe Wave pattern.
- Enter a buy trade at the close of the confirmation candle.
- Place a stop loss below the recent swing low.
- Set take profit at the Wolfe Wave target line or with a fixed 20–30 pip goal.
Sell Setup
- Wait for the Check Mark Pattern at the Stochastic indicator to display an overbought signal (above 80).
- Ensure the Wolfe Wave Forex Indicator shows a valid bearish Wolfe Wave pattern.
- Enter a sell trade at the close of the confirmation candle.
- Place a stop loss above the recent swing high.
- Set take profit at the Wolfe Wave target line or with a fixed 20–30 pip goal.
Trader Case Studies
Below are examples of traders who applied this strategy to different currency pairs and timeframes, demonstrating its effectiveness in various market conditions.
Elena V – Russia
Elena V, a swing trader from Russia, applied this strategy on the USD/CAD and EUR/GBP pairs over 20 days. She gained a total of +270 pips by combining the reversal signals of the Wolfe Wave with the momentum clues from the Stochastic indicator.
Jamal K – Kenya
Jamal K, a day trader from Kenya, used this strategy on the GBP/USD and EUR/USD pairs with a 15-minute timeframe. Over 27 days, he netted +220 pips. Jamal appreciated how the Wolfe Wave patterns helped confirm his entries after the Check Mark Pattern signaled oversold or overbought conditions.
Marie C – France
Marie C, a part-time trader from France, applied the strategy on the USD/JPY pair over 35 days. She reported a profit of +310 pips and noted the strategy’s ability to provide clear, low-risk trade setups in ranging markets.
Disclaimer: These case studies are for educational purposes only. Trading results will vary depending on market conditions, risk management, and individual discipline.
Advantages of This Strategy
- Combines overbought/oversold signals with geometric pattern analysis for higher accuracy.
- Suitable for various timeframes and currency pairs.
- Helps in identifying optimal entry and exit points.
- Reduces false signals by aligning two reliable indicators.
Drawbacks and Considerations
- Requires discipline to wait for both indicators to confirm before entering trades.
- May underperform in highly volatile or sideways markets.
- Effective risk management is essential to protect capital.
- May require frequent monitoring depending on the chosen timeframe.
Strategy Conclusion and Tips
This combined strategy offers a robust approach to trading by integrating overbought/oversold signals with geometric pattern analysis.
Traders should ensure both indicators align before entering trades to maximize success.
Proper stop loss and take profit settings tailored to market conditions are crucial for risk control.
Practice on demo accounts is recommended to build confidence and adjust settings before live trading.
Indicator Specifications
| Platform | MetaTrader 4 (MT4) |
|---|---|
| Asset Classes | Forex, Indices, Commodities, Crypto (CFD) |
| Timeframes | M1–D1 |
| Alerts | Popup, Sound, Email, Push (optional) |
| Drawing | On-chart arrows/labels for check mark signals |
| Inputs |
|
FAQ
Does it repaint?
Signals are shown when the pattern confirms at bar close. Historical labels reflect confirmed conditions and should not repaint.
Which pairs and sessions work best?
Highly liquid pairs (EURUSD, GBPUSD, USDJPY, XAUUSD) during London/NY sessions typically offer cleaner momentum turns.
Can I use it without any other indicators?
You can, but performance improves by filtering with trend (EMA 200) and levels (daily S&R).
What SL/TP do you recommend?
Use structure-based SL beyond the signal swing and aim for 1.5R–2R as a baseline; trail for extended moves.
Best timeframe for beginners?
M15–H1 balances signal frequency and noise, making it a good starting point before moving to lower timeframes.
Final Words
The Check Mark Pattern at Stochastic indicator turns a classic oscillator into a practical signal engine.
Combine it with a simple trend filter and clean levels, and you have a disciplined, repeatable approach for both intraday and swing trading.


