
About the Color MA Signal Indicator
The Color MA Signal is a free MetaTrader 4 (MT4) indicator that transforms the traditional moving average into a dynamic, bi-colored trend signal tool.
It appears directly on the main chart as a moving average line that changes color based on market direction, offering an intuitive visual cue for traders to identify trend shifts and potential entry points.
Key Features
- Bi-Colored Moving Average: The indicator changes color to represent the current market trend — green for bullish and red for bearish.
- Real-Time Signal Updates: Provides immediate visual feedback on trend direction, aiding in timely decision-making.
- Customizable Parameters: Allows traders to adjust the moving average period and other settings to suit their trading style.
- Non-Repainting: Once a signal is generated, it remains on the chart, ensuring reliability in analysis.
- Easy Integration: Can be used as a standalone tool or in conjunction with other indicators for enhanced trading strategies.
Free Download
Download the “color-ma-indicator.mq4” indicator for MT4
Benefits of Using the Indicator
- Improved Trend Identification: The color-changing line provides a clear visual representation of market trends.
- Enhanced Entry and Exit Points: Helps traders pinpoint optimal moments to enter or exit trades based on trend changes.
- Increased Trading Confidence: Simplifies decision-making by offering straightforward trend signals.
- Versatility Across Timeframes: Effective on various timeframes, making it suitable for different trading styles.
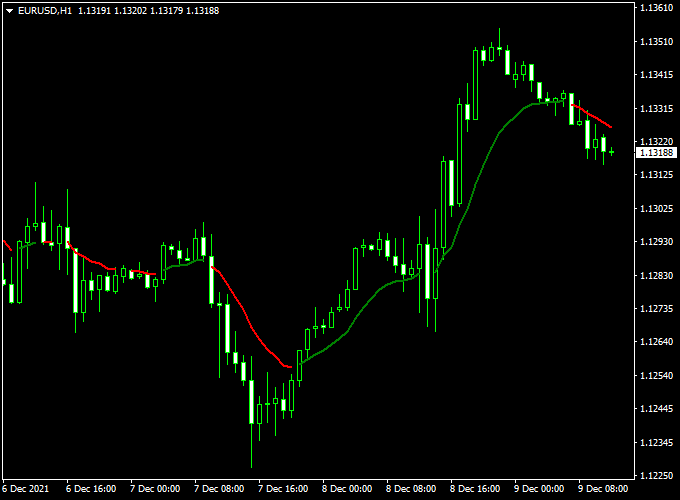
Example Chart (EUR/USD H1)
Below is an example of the Color MA Signal Indicator applied to an H1 EUR/USD chart.
The green and red line indicates bullish and bearish trends, respectively, assisting traders in making informed decisions.
How to Trade Using This Indicator
Entry Signals
- Buy Signal: Enter a buy trade when the indicator turns green, indicating a bullish trend.
- Sell Signal: Enter a sell trade when the indicator turns red, indicating a bearish trend.
Stop Loss and Take Profit Guidelines
- Stop Loss: Place a stop loss below the recent swing low for buy trades and above the recent swing high for sell trades.
- Take Profit: Aim for a risk-reward ratio of at least 1:2, adjusting based on market conditions and volatility.
Trade Management Tips
- Monitor the indicator for color changes to adjust positions accordingly.
- Use additional indicators or price action analysis to confirm signals.
- Adjust position sizes and risk management strategies based on market volatility.
Pros
- Provides clear and immediate visual trend signals.
- Easy to use and understand, making it suitable for traders of all levels.
- Customizable settings to fit individual trading preferences.
- Compatible with various currency pairs and timeframes.
Cons
- May produce false signals during low volatility or sideways markets.
- Should be used in conjunction with other tools for optimal performance.
Download Now
Download the “color-ma-indicator.mq4” indicator for Metatrader 4
Trend Confirmation MT4 Strategy: Color MA Signal + Ehlers Histogram Oscillator
This strategy pairs the Color MA Signal Forex Indicator with the Ehlers Histogram Forex Oscillator, a simple histogram that indicates buy (blue bars) and sell (red bars) signals.
What Is This Strategy About?
Combining a visual trend indicator (Color MA Signal) with a momentum-based histogram (Ehlers Oscillator) allows traders to confirm trend direction before entering trades.
By entering only when both indicators align, price above a green MA signal, and the Ehlers histogram turning blue (or vice versa), you significantly reduce false entries and adapt to both trending and ranging markets.
Buy and Sell Rules
Buy Setup
- Wait for the Color MA indicator to turn green, indicating a bullish trend.
- Confirm that the Ehlers Histogram has turned blue, signaling upward momentum.
- Enter a buy at the close of the bar where both conditions align.
- Place a stop loss below the recent swing low or a significant support zone.
- Take profit at a minimum 1:2 risk-to-reward ratio or target the next resistance level.
Sell Setup
- Wait for the Color MA to turn red, indicating a bearish trend.
- Confirm that the Ehlers Histogram has turned red, signaling downward momentum.
- Enter a sell at the close of the bar where both conditions align.
- Place a stop loss above the recent swing high or the resistance zone.
- Take profit at a 1:2 risk-to-reward ratio or next significant support.
Trader Case Studies
Here are three examples of traders applying this strategy in unique ways.
Olivia P – Canada
Olivia, a part-time trader, tested the setup on H4 charts of EUR/JPY and USD/CHF over 5 weeks. She only entered trades when both indicators confirmed the same direction and managed to collect +380 pips. Her biggest win came from a three-day bullish move on EUR/JPY that she rode with minimal drawdown.
Marcus T – South Africa
Marcus, a scalper focusing on the London session, used the strategy on M5 charts of GBP/USD and EUR/GBP for 12 trading days. He achieved +165 pips despite volatile market swings by sticking strictly to aligned signals and cutting losses quickly on false starts.
Yuki H – Japan
Yuki, a position trader, applied the method on D1 charts of AUD/USD and NZD/USD over two months. Her patient approach led to fewer trades but bigger wins, netting +620 pips. She credits the histogram’s momentum confirmation for keeping her in long-term trends without second-guessing.
Disclaimer: These case studies are illustrative. Results vary depending on trader discipline, market conditions, and risk management.
Advantages of This Strategy
- Easy-to-read visual trend cues and momentum confirmation reduce confusion.
- Effective in both trending and mildly ranging markets.
- Works across multiple timeframes, from scalping to swing trading.
- Non-repainting signals ensure consistency and reliability.
Drawbacks and Considerations
- Late entries are possible in fast-moving markets due to repaint-safe signals.
- Requires disciplined adherence to signal alignment; avoid emotional trades.
- Best to demo test first to understand timing and signal frequency.
Strategy Conclusion & Practical Tips
This strategy gives traders a reliable framework by blending trend detection with momentum verification.
Start with demo testing on your preferred timeframe, track your results, and adjust stop/take-profit distances based on pair volatility.
Helpful tips: use during active sessions (London or NY), avoid low-liquidity times or major news events, and consider combining with support/resistance zones for more robust targets.
Indicator Specifications
| Platform | MetaTrader 4 (MT4) |
|---|---|
| Indicator Type | Trend Signal (Bi-Colored Moving Average) |
| Timeframes | All timeframes (M1 to D1) |
| Currency Pairs | All major and minor pairs |
| Inputs |
|
| Repainting | No |
FAQ
Does the Color MA Signal Indicator repaint?
No, the Color MA Signal Indicator does not repaint. Once a signal is generated, it remains on the chart, providing reliable analysis.
Can I use this indicator for scalping?
Yes, the Color MA Signal Indicator is suitable for scalping, especially when combined with other tools like the Forex Trend Reversal Signals indicator for precise entry points.
Is this indicator compatible with all currency pairs?
Yes, the Color MA Signal Indicator works with all major and minor currency pairs. However, it’s essential to test it on a demo account to understand its behavior with different pairs.
Final Words
The Color MA Signal Indicator for MT4 offers traders a straightforward and effective tool for trend analysis.
By providing clear buy and sell signals through a bi-colored moving average, it simplifies decision-making and enhances trading strategies.
Remember to practice on a demo account and incorporate proper risk management techniques to maximize its effectiveness.


