About the Indicator
The free Critical Points indicator for MT4 (Metatrader 4) works with moving averages and Fibonacci levels and displays the Critical Points trading algorithm on the chart.
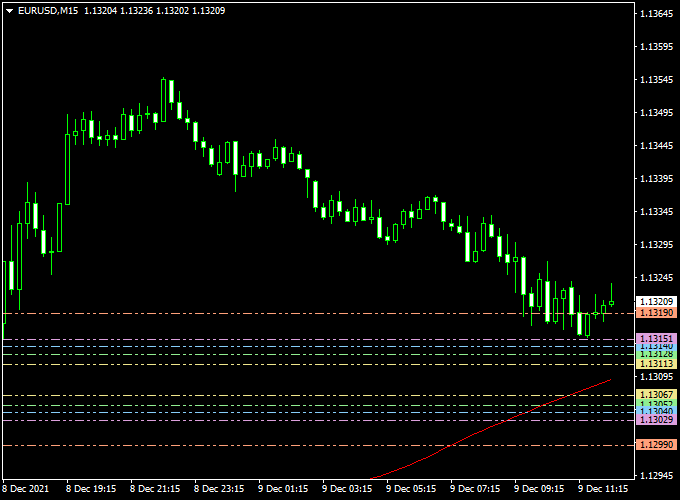
The indicator appears in the main MT4 chart window as a set of horizontal critical level lines.
The default moving averages period is set to 157.
Buy & sell signal
- A buy signal occurs whenever the price breaks through the critical resistance levels.
- A sell signal occurs whenever the price breaks through the critical support levels.
Free Download
Download the “critical-points.mq4” indicator for MT4
Key Features
- Automatically plots pivot points (daily, weekly), plus associated support/resistance zones.
- Dynamic calculation—levels adjust as price and timeframes change.
- Customizable styling for lines and zones (colors, widths, opacity).
- Alerts when price touches or breaks critical levels (sound, email, push).
Indicator Example Chart (EUR/USD M15)
The chart below shows automatically plotted pivot levels (daily/weekly) along with support/resistance zones.
These “critical points” highlight areas where price may reverse, stall, or breakout. Combine with price action for higher-probability trades.

How To Trade Using This Indicator
Entry Logic
Watch for the price approaching a pivot level or zone. Look for confirmation—such as a pin bar, engulfing candle, or rejection wicks—to take a trade.
In breakout scenarios, wait for a candle close beyond the level, followed by a retest of that line or zone before entering.
Stop Loss
Place stops just behind the critical level or zone: below a support pivot for longs and above a resistance pivot for shorts.
This method protects you from false breakouts while keeping risk tight and logical.
Take Profit
Consider targeting the next pivot level or key zone opposite your entry. If trading a range, exit near the opposing boundary.
When trending, trail your stop beyond subsequent critical levels to lock in profits while letting the trend run.
Download Now
Download the “critical-points.mq4” indicator for Metatrader 4
Critical Points Forex Indicator + Fisher Transform MT4 Strategy
This strategy combines the Critical Points Forex Indicator (MT4).
This indicator shows key support and resistance levels based on moving averages and Fibonacci levels, helping traders spot important price zones.
It works alongside the Fisher Transform Metatrader 4 Forex Indicator, a trend-following oscillator.
The Fisher Transform identifies price reversals and measures trend strength to help time entries and exits.
Buy Entry Rules
- Ensure the Fisher Transform indicator is above the zero line, indicating a bullish trend.
- Wait for the price to break above a critical resistance level identified by the Critical Points indicator.
- Enter a buy position upon confirmation of both conditions.
- Set a stop loss below the recent swing low or a significant support level.
- Set a take profit target based on a favorable risk-to-reward ratio or a predetermined Fibonacci level.
Sell Entry Rules
- Ensure the Fisher Transform indicator is below the zero line, indicating a bearish trend.
- Wait for the price to break below a critical support level identified by the Critical Points indicator.
- Enter a sell position upon confirmation of both conditions.
- Set a stop loss above the recent swing high or a significant resistance level.
- Set a take profit target based on a favorable risk-to-reward ratio or a predetermined Fibonacci level.
Trader Case Studies
Here are examples of traders from different countries who successfully applied this strategy:
Maria S – Spain
Elena, a swing trader from Portugal, used this strategy on the EUR/USD pair. By carefully following the entry and exit rules, she earned a total of +303 pips over a month.
Johan D – The Netherlands
Johan, a day trader from the Netherlands, applied this system to the GBP/USD pair. Over 20 trading days, he gained +180 pips by strictly following the strategy guidelines.
Fatima M – Morocco
Fatima, a part-time trader from Morocco, traded the AUD/USD pair with this approach. Her consistent use of the indicators led to profits totaling +107 pips in three weeks.
Disclaimer: These case studies are for educational purposes only. Results may vary depending on market conditions, risk management, and individual discipline.
Advantages
- Combines key support/resistance levels with trend-following signals for better trade entries.
- Helps identify potential price reversals with good risk-to-reward setups.
- Applicable to various trading styles and timeframes.
Drawbacks
- May produce false signals in choppy or range-bound markets.
- Requires experience to interpret signals and manage trades effectively.
- Best suited for major currency pairs with good liquidity.
Strategy Conclusion and Tips
This strategy effectively uses the Critical Points Forex Indicator to mark important price levels, combined with the Fisher Transform to confirm trend direction and reversals.
This combination helps traders time entries and exits with more confidence.
Traders should practice this approach on demo accounts to become familiar with the signals.
Proper risk management, including stop losses and take profits, is essential.
Avoid trading during uncertain market conditions, and consider supplementing this strategy with additional technical or fundamental analysis for improved results.
Indicator Specifications
| Platform | MetaTrader 4 (MT4) |
|---|---|
| Indicator Type | Pivot, Support & Resistance Zones |
| Timeframes | All MT4 timeframes (M1–MN1); pivots based on daily/weekly options |
| Symbols | All MT4 instruments |
| Alerts | On touch or break of any level (sound, email, push) |
| Inputs |
|
| File | MT4 .ex4 indicator (free download) |
FAQ
1) What are “critical points”?
These are pivot levels (daily/weekly) and their derived zones of support/resistance—areas where price is likely to react.
2) Can I customize pivot timeframes?
Absolutely—you can choose daily, weekly, or custom periods for pivot calculation, depending on your trading horizon.
3) Is it useful in range and trending markets?
Yes. In ranges, use reversals at pivots or zones; in trends, trade breakouts and retests of critical levels.
4) Will the levels repaint?
No. Levels are based on completed bars and do not repaint once plotted.
5) Which timeframes suit this best?
Daily and H4 charts work well for swing trades. Day traders can benefit from H1–M15 charts to capture intraday pivot reactions.
Final Words
Enhancing Results with This Strategy
The Critical Points Forex Indicator delivers clear, evidence-based levels to prepare for price reactions.
It’s a strategic tool for identifying zones of decision.
Pair it with price action confirmation—like rejection candles or trend filters—to maximize accuracy and confidence in entries.


