
About the Indicator
The Price Border Forex Indicator for MT4 draws dynamic support and resistance zones (borders) around price structures, helping you instantly identify trading zones such as range tops, bottoms, and breakout areas.
These borders adjust to recent swings and volatility, giving you clear visual guidance on key areas to watch.
This makes planning entries, exits, and stop zones more intuitive and evidence-based.
Built for clarity and simplicity, Price Border works seamlessly on any pair or timeframe, requiring minimal setup and giving maximum context.
Buy & sell signal
- A buy signal occurs when the Price Border indicator is sloping up (up-trending market) and the price touches the lower blue channel line.
- A sell signal occurs when the Price Border indicator is sloping down ( down trending market) and the price touches the upper red channel line.
Free Download
Download the “cPrice Border.ex4” indicator for MT4
Key Features
- Automatically plots dynamic horizontal “border” bands based on recent swings.
- Zones adapt to changing volatility and market structure.
- Fully customizable lookback period, volatility buffer, and styling.
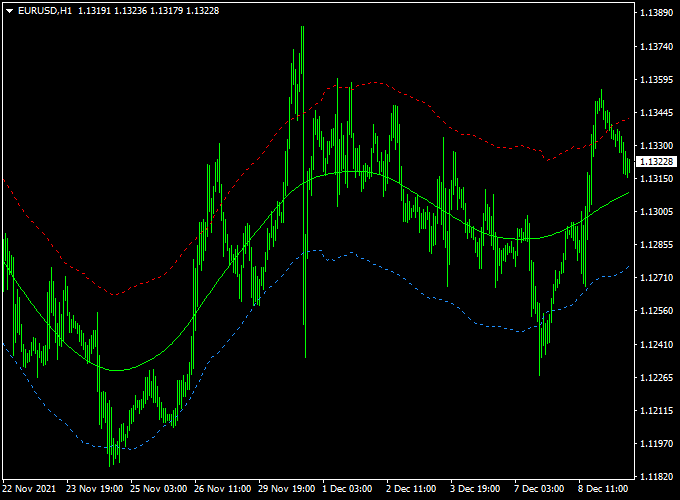
Indicator Example Chart (EUR/USD H1)
The chart below shows the Price Border zones—upper and lower levels based on recent swing highs and lows.
Price approaching or breaching these zones signals potential breakout, reversal, or continuation. Use area confluence for decision-making.
How To Trade Using This Indicator
Entry Logic
When price touches the lower border and shows bullish confirmation (e.g., pin bar or double bottom), consider a long entry.
Conversely, when price reaches the upper border with bearish signals, it offers a potential short.
For breakout plays, wait for price to close beyond a border and then retest it—this retest often provides a lower-risk entry point with clear invalidation.
Stop Loss
Place stops just beyond the border zone—below for longs, above for shorts. This keeps risk tight and respects the dynamic nature of the indicator.
Take Profit
Target the opposite border if in a range, or aim for recent swing levels if a breakout occurs. Scaling out partially as price nears the opposite border helps manage risk.
In trending markets, trail stops using new border levels or ATR to lock incremental profits while allowing the trend to run.
Download Now
Download the “cPrice Border.ex4” indicator for Metatrader 4
Price Border Forex Indicator + Flag and Pennants MT4 Strategy
This strategy combines the Price Border Forex Indicator (MT4), which shows a dynamic trend-following channel with three colored lines, and the Flag and Pennants Metatrader 4 Forex Indicator, which detects flag and pennant chart patterns that typically signal trend continuation.
Buy Entry Rules
- Identify an uptrend where the price is above the middle channel line of the Price Border indicator.
- Wait for the price to touch or bounce off the lower blue channel line, signaling potential support.
- Confirm the presence of a bullish flag or pennant pattern detected by the Flag and Pennants indicator.
- Enter a buy position when both indicators align—price action near the lower channel line and a confirmed bullish flag or pennant pattern.
- Set a stop loss below the recent swing low or just outside the lower channel line to manage risk.
- Set a take profit based on the height of the flag/pennant pattern or previous resistance levels, aiming for a favorable risk-reward ratio.
Sell Entry Rules
- Identify a downtrend where the price is below the middle channel line of the Price Border indicator.
- Wait for the price to touch or bounce off the upper red channel line, signaling potential resistance.
- Confirm the presence of a bearish flag or pennant pattern detected by the Flag and Pennants indicator.
- Enter a sell position when both indicators align—price action near the upper channel line and a confirmed bearish flag or pennant pattern.
- Set a stop loss above the recent swing high or just outside the upper channel line to manage risk.
- Set a take profit based on the height of the flag/pennant pattern or previous support levels, aiming for a good risk-reward ratio.
Trader Case Studies
Here are examples of traders from different countries who successfully applied this strategy on various currency pairs and timeframes:
Thomas B – USA
Thomas, a day trader from the USA, applied this system to USD/JPY and EUR/JPY. He earned +275 pips over 20 trading days by following the strategy rules strictly.
Marie L – France
Marie, a part-time trader from France, traded AUD/USD and USD/CAD with this approach. Her disciplined use of the indicators resulted in +287 pips in profits within three weeks.
Disclaimer: These case studies are for educational purposes only. Results may vary depending on market conditions, risk management, and individual discipline.
Advantages
- Combines trend-following channel analysis with reliable chart pattern recognition.
- Helps identify high-probability breakout trades within trending markets.
- Clear entry and exit points based on price action and pattern confirmation.
Drawbacks
- Less effective in sideways or highly volatile markets where patterns fail.
- Requires experience to correctly interpret price action around channel borders.
- It may generate false signals if pattern detection is inaccurate.
Strategy Conclusion and Tips
This strategy effectively blends the dynamic channel insights of the Price Border indicator with the pattern recognition power of the Flag and Pennants indicator.
By focusing on price action near channel borders combined with confirmed flag or pennant patterns, traders can better time entries and exits.
To maximize success, practice identifying clean flag and pennant formations and confirm trends using the channel lines.
Always use stop losses outside recent swing points and adjust take profits for a positive risk-to-reward ratio.
Consistency, patience, and sound risk management are key to benefiting from this strategy over time.
Indicator Specifications
| Platform | MetaTrader 4 (MT4) |
|---|---|
| Indicator Type | Dynamic Support & Resistance Zones |
| Timeframes | All MT4 timeframes (M1–MN1) |
| Symbols | All Forex, metals, and CFD instruments in MT4 |
| Alerts | Sound, Email, Push upon border touch/break |
| Inputs |
|
| File | MT4 .ex4 indicator (free download) |
FAQ
1) What do the borders represent?
The borders draw upper and lower zones based on recent swing points. They act as dynamic support and resistance areas.
2) Can I adjust the lookback or buffer?
Yes. You can customize the number of bars to consider and apply a buffer to expand or shrink zones.
3) Is it useful for both ranges and trends?
Definitely. In ranging markets, trade reversals at the borders; in trending markets, use breakouts and retests for entries.
4) Does it work on any timeframe?
Yes. From ticks and intraday charts to daily/monthly timeframes—this indicator adapts fluidly.
5) Do borders repaint?
No. Borders are plotted based on fully formed swing highs and lows. Once established, they remain stable and do not repaint.
Final Words
Enhancing Results with This Strategy
The Price Border Forex Indicator helps you visualize in-chart zones where price often reacts—making trade setups clearer.
Combine it with price action signals—like pin bars or engulfing patterns—for stronger entries at the borders, or use breakouts with confirmed retests.
This method has proven effective in both range-bound and trending contexts. Always adjust to your risk profile and demo-test before live deployment.


