
About the Currencies Heat Map Indicator
The Currencies Heat Map Indicator for MT4 is a sophisticated tool designed to provide a real-time overview of the entire forex market.
It functions by comparing the relative strength and weakness of individual currencies rather than just looking at a single price chart.
By using a color-coded system, the tool simplifies complex market data into an actionable table that highlights momentum shifts as they happen.
Using the Currencies Heat Map Indicator helps you avoid the common mistake of trading two strong currencies against each other, which often leads to sideways price action.
It directs your focus toward the most explosive pairings where a clear imbalance of power exists.
Free Download
Download the “currency-heatmap.ex4” MT4 indicator
Key Features
- Provides a comprehensive comparison table of currency strength across multiple pairs.
- Uses a four-color grading system to distinguish between strong and weak momentum.
- Updates in real time to reflect current market conditions and volatility.
- Identifies the best trending pairs by matching the strongest currency against the weakest.
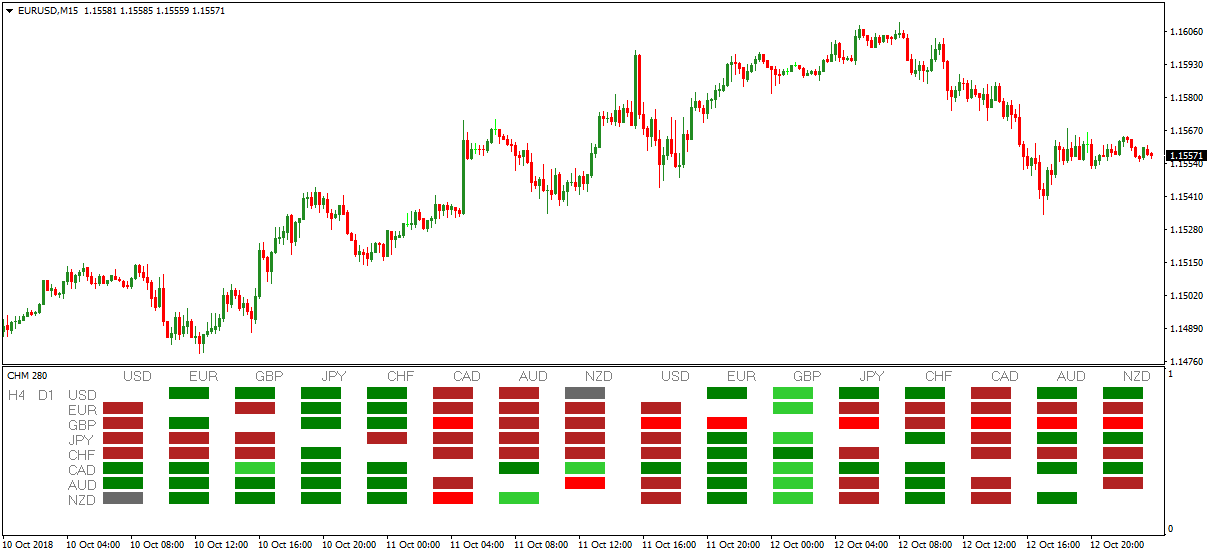
Indicator Chart
The Currencies Heat Map Indicator appears as a clean table on your MT4 workspace.
It displays various currency symbols next to specific color blocks that represent their current trend status.
Lime green and red blocks signify the most intense momentum, allowing you to quickly scan for the best trading opportunities without opening dozens of different windows.
Guide to Trade with Currencies Heat Map Indicator
Buy Rules
- Identify a currency colored lime green which represents the strongest upward momentum.
- Find a second currency colored firebrick which indicates the weakest downward momentum.
- Combine these two to form a pair where the strong currency is the base and the weak is the quote.
- Verify the bullish setup with a secondary trend filter before entering a long position.
Sell Rules
- Look for a currency colored red to identify the strongest downward momentum.
- Locate a currency colored green which represents the weakest upward momentum.
- Match these currencies to find a pair where the strong selling pressure outweighs the weak buying.
- Confirm the bearish alignment with price action or an oscillator before executing a short trade.
Stop Loss
- Place the stop loss below the most recent support level or swing low for buy orders.
- Set the stop loss above the nearest resistance level or swing high for sell orders.
Take Profit
- Aim for a take profit level that offers at least a two-to-one reward-to-risk ratio.
- Exit the position manually near major psychological price levels or previous daily extremes.
Currencies Heat Map + FX Forecaster Oscillator MT4 Trend Strategy
This MT4 strategy combines the Currencies Heat Map Strong Trend Metatrader 4 Forex Indicator and the FX Forecaster Oscillator Metatrader 4 Forex Indicator.
The Currencies Heat Map lets you quickly identify strong and weak currencies in one easy-to-read table.
Lime green represents the strongest upward trending currencies, green represents weaker upward trends, red represents the strongest downward trends, and firebrick represents weaker downward trends.
The FX Forecaster Oscillator provides entry signals: a buy occurs when both price bar histograms are above zero, and a sell occurs when both are below zero.
Combining these indicators helps traders identify the strongest trending pairs and enter trades at the right moment.
This strategy works best on 15-minute and 30-minute charts for intraday trading.
It is suitable for major and minor currency pairs and is ideal for traders looking to capture clear trend moves while filtering out weaker, choppy pairs.
Using both indicators together improves timing and increases the probability of successful trend trades.
Buy Entry Rules
- Check the Currencies Heat Map and identify the strongest upward trending currencies, colored lime green.
- Select a pair where the base currency is strong and the quote currency is weak or showing downward pressure.
- Confirm the FX Forecaster Oscillator shows both histograms aligned above the zero level for the chosen pair.
- Enter a buy trade when both indicators confirm a strong bullish trend.
- Set stop loss below the recent swing low or below a support level.
- Set take profit at a risk-reward ratio of 1:1.5 or trail the stop as the trend continues.
Sell Entry Rules
- Check the Currencies Heat Map for the strongest downward trending currencies, colored red.
- Select a pair where the base currency is weak and the quote currency is strong.
- Confirm the FX Forecaster Oscillator shows both histograms aligned below zero for the chosen pair.
- Enter a sell trade when both indicators confirm a strong bearish trend.
- Place a stop loss above the recent swing high or above a resistance level.
- Take profit at a 1:1.5 risk-reward ratio or trail the stop to capture trend continuation.
Advantages
- Combines broad currency strength context with precise oscillator entries.
- Helps avoid weak or range-bound pairs, focusing only on strong trends.
- Clear buy and sell rules reduce subjectivity and simplify decision-making.
- Works on multiple currency pairs and time frames for intraday trading.
- The trailing stop option allows capturing extended trend moves for higher profits.
Drawbacks
- May produce false signals during low volatility or choppy market conditions.
- Requires monitoring multiple currencies and oscillator histograms simultaneously.
- Not suitable for very short-term scalping on M1 charts.
Case Study 1
On the EUR/USD 15-minute chart, the Currencies Heat Map shows EUR as lime green (strongest up) and USD as red (weakest down).
The FX Forecaster Oscillator histograms for the pair align above zero.
A buy trade is entered at 1.1205, stop loss at 1.1195, and take profit at 1.1227 based on a 1:1.5 risk-reward ratio.
The price moves steadily and reaches the take profit, capturing 22 pips.
Case Study 2
On the GBP/CHF 30-minute chart, the Heat Map shows GBP as red (strongest down) and CHF as lime green (strongest up).
The FX Forecaster Oscillator histograms align below zero.
A sell trade is entered at 1.2340, stop loss at 1.2360, and take profit at 1.2310.
The market moves down and hits the take profit for a gain of 30 pips.
Strategy Tips
- Only trade pairs with clear, strong versus weak currency signals on the Heat Map.
- Use 15-minute and 30-minute charts during high liquidity sessions for better trend-following opportunities.
- Consider a trailing stop to maximize profit in strong trending moves.
- Combine with additional support and resistance levels for extra confirmation when setting stop loss and take profit.
Download Now
Download the “currency-heatmap.ex4” Metatrader 4 indicator
FAQ
What do the different colors in the Currencies Heat Map Indicator represent?
The color scheme is designed to show trend intensity.
Lime green indicates the strongest upward trend, while standard green shows a weaker upward move.
Conversely, red highlights the strongest downward trend, and firebrick represents a weaker downward move. This allows you to pick the absolute best performers.
How often does the heat map update its data?
The tool updates with every tick, ensuring that the strength values you see are current.
This real-time processing is vital for capturing momentum early in a session, especially during the London and New York overlaps when currency strength can shift rapidly.
Summary
The Currencies Heat Map Indicator is an invaluable asset for traders who want to stay organized and informed.
By providing a clear ranking of currency performance, it eliminates the need to guess which pair will move the most.
Its main strength lies in its ability to pair the highest momentum currency with the lowest, creating high-probability trade setups.
This tool improves your decision-making process by keeping you focused on the most active parts of the market.
Integrating it into your routine will likely lead to more disciplined trading and better pair selection.


