
About the Daily Forex Data indicator
The Daily Data indicator for MT4 is a market information tool that gathers essential daily trading statistics and displays them in a single corner of the platform.
Instead of switching between windows or calculating values manually, traders can view all relevant data at a glance while monitoring price movement.
The indicator shows details such as the current day’s range, price change, distance from the daily high and low, spread, swap values, candle information, and a session timer.
This overview helps traders stay aware of current conditions without interrupting their workflow.
Each data element can be shown or hidden through the settings menu.
This flexibility allows traders to customize the display and focus only on the information that supports their trading style.
The indicator fits both intraday and swing traders who value situational awareness and efficient decision-making.
Free Download
Download the “daily-data-indicator.mq4” MT4 indicator
Key Features
- Displays comprehensive daily market data in one panel.
- Shows range, daily change, and distance from high and low.
- Includes spread, swap rates, candle data, and session timer.
- Customizable inputs to show or hide specific data fields.
- Helps traders stay informed without leaving the price screen.
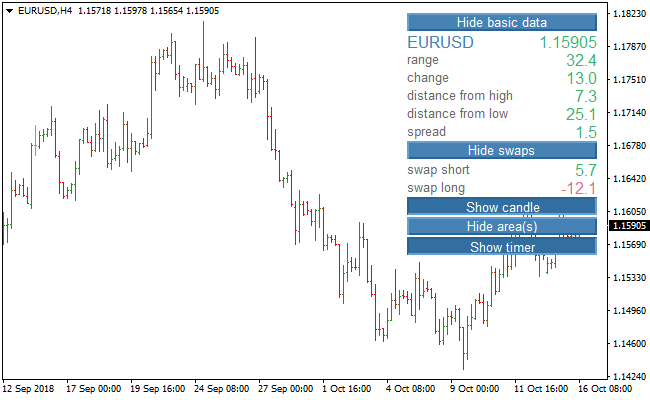
Indicator Chart
The image below displays the Daily Data indicator applied to a forex price chart.
All key daily statistics appear in a compact area, allowing traders to track market conditions while focusing on price behavior.
Guide to Trade with the Daily Forex Data Indicator
Buy Rules
- Confirm that the daily range shows sufficient movement.
- Check that spread conditions are favorable before entry.
- Align buy trades with positive daily price change.
- Use the indicator as confirmation alongside your main strategy.
Sell Rules
- Confirm that daily volatility supports downside movement.
- Ensure the spread remains stable during the entry period.
- Align sell trades with a negative daily price change.
- Avoid entries when the range remains unusually tight.
Stop Loss
- Set the stop loss beyond the current day’s high or low.
- Use distance-from-high or distance-from-low data as a reference.
- Increase stop size slightly on high-range days.
- Keep overall risk consistent regardless of volatility.
Take Profit
- Close the entire trade when daily range expansion slows.
- Exit if price change stalls near the opposite daily extreme.
- Alternatively, target a fixed percentage of the daily range.
- Lock in gains early during sessions with widening spreads.
Daily Forex Data + Chandelier Exit Strategy for MT4 Day Trading
This strategy combines the comprehensive market overview provided by the Daily Data MT4 Indicator with trend and exit signals from the Chandelier Exit MT4 Indicator.
The Daily Data indicator displays key information such as currency pair, daily range, daily change, distance from high and low, spread, swap rates, candle status, timer, and area levels.
The Chandelier Exit indicator gives buy signals with an orange line and sell signals with a magenta line.
Using both indicators allows traders to identify strong intraday setups and manage exits effectively.
This strategy is designed for M15 and H1 charts, suitable for day trading.
Trades are taken when the Chandelier Exit signal aligns with market conditions observed on the Daily Data indicator.
This ensures that trades are entered in the direction of intraday momentum while considering volatility and support/resistance areas.
Buy Entry Rules
- Chandelier Exit shows an orange line, signaling a buy.
- Daily Data indicator confirms bullish conditions, such as price near daily low or above key support areas.
- Enter a buy trade at the close of the signal candle or the next candle open.
- Place a stop loss below the recent swing low or below the nearest support area displayed by Daily Data.
- Take profit when the Chandelier Exit changes color to magenta or when the price reaches the resistance level on the Daily Data indicator.
Sell Entry Rules
- Chandelier Exit shows a magenta line, signaling a sell.
- Daily Data indicator confirms bearish conditions, such as price near daily high or below key resistance areas.
- Enter a sell trade at the close of the signal candle or the next candle open.
- Place a stop loss above the recent swing high or above the nearest resistance area displayed by Daily Data.
- Take profit when the Chandelier Exit changes color to orange or when the price reaches the support level on the Daily Data indicator.
Advantages
- Daily Data provides a full market overview, helping traders identify optimal trade entries based on volatility and range.
- Chandelier Exit provides clear trend-based entry and exit signals, simplifying trade management.
- Combining both indicators improves the probability of successful intraday trades.
- Works on M15 and H1 charts, allowing multiple trades per day while keeping risk manageable.
- Stop loss and take profit can be logically based on swing highs/lows and support/resistance levels provided by Daily Data.
Drawbacks
- Requires monitoring both indicators and multiple pairs, which may be time-consuming for some traders.
- Profit targets may be missed if the trend reverses before hitting the Chandelier Exit color change or area levels.
Case Study 1 – Buy Trade on EURUSD M15
During the London session, the Chandelier Exit indicator turned orange, signaling a buy.
The Daily Data indicator showed price near the daily low with a support area at 1.1005.
A buy trade was entered at 1.1010 with a stop loss at 1.0995.
Price rallied to 1.1045, and the trade was closed when the Chandelier Exit changed to magenta, resulting in a gain of 35 pips.
The combination of trend signal and intraday support level provided a strong day trading setup.
Case Study 2 – Sell Trade on GBPJPY H1
On GBPJPY H1, the Chandelier Exit turned magenta, signaling a sell.
Daily Data indicated price near daily high with resistance at 164.20.
A sell trade was opened at 164.15 with a stop loss at 164.35.
Price moved down to 163.70 before the Chandelier Exit gave an orange buy signal.
The trade was closed for a profit of 45 pips.
Strategy Tips
- Check Daily Data for volatility, spread, and support/resistance areas before entering trades.
- Focus on active sessions such as London and New York when price reacts strongly to intraday levels.
- Use reasonable position sizing and avoid overleveraging because crypto and forex can have rapid intraday moves.
- Do not enter trades if the signal contradicts key support or resistance zones.
- Exit trades early if the Chandelier Exit color changes or price approaches strong area levels on Daily Data.
- Practice the strategy on a demo account to understand timing and signal alignment on M15 and H1 charts.
Download Now
Download the “daily-data-indicator.mq4” Metatrader 4 indicator
FAQ
Is the Daily Data indicator a trading signal tool?
No. It is designed to provide market context and statistics rather than direct buy or sell signals.
Can I customize which data is displayed?
Yes. Each data field can be enabled or disabled through the indicator inputs.
Does the indicator update in real time?
The displayed values update automatically as market conditions change throughout the day.
Who benefits most from this indicator?
Traders who rely on market awareness, volatility tracking, and cost monitoring benefit the most.
Summary
The Daily Data indicator offers a practical way to track essential daily trading statistics in one place.
It improves efficiency by keeping important information visible at all times.
The indicator performs strongly as a supporting tool for most trading strategies.
While it does not generate signals, it enhances decision-making by providing real-time context and customizable market data.


