About the Indicator
The DEMA Forex Indicator for MetaTrader 4 (MT4) is a custom-built tool designed to display the proven DEMA trading algorithm on your chart.
This indicator appears in a separate MT4 chart window as green-colored bars, providing clear visual cues for potential market movements.
Buy & Sell Trade Example
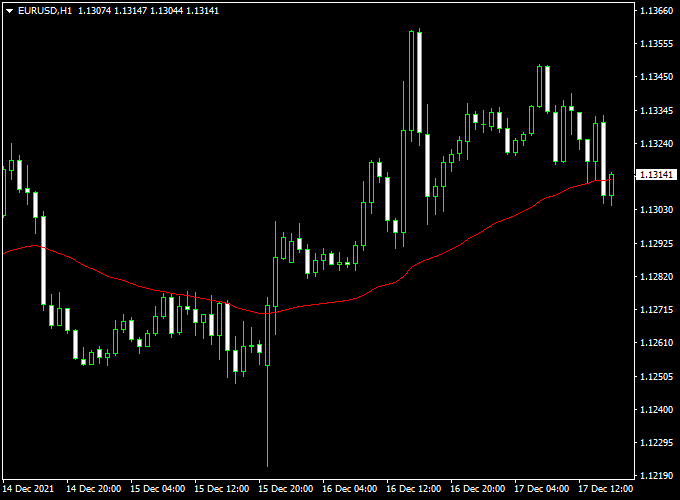
- Open a buy order whenever the candlestick crosses the red Dema line upwards.
- Open a sell order whenever the candlestick crosses the red Dema line downwards.
- Reverse the open buy or sell position whenever an opposite signal occurs on the chart.
Free Download
Download the “dema-indicator.mq4” indicator for MT4
Key Features
- Custom-built for MT4, displaying the DEMA trading algorithm.
- Appears as green-colored bars in a separate chart window.
- Can be used for both trade entry and exit signals.
- Serves as a confirmation tool for buy and sell setups from other strategies.
- Free to download and easy to install on your MT4 platform.
Indicator Example Chart (EUR/USD H1)
The picture below shows the Dema indicator in action on the trading chart.

Download Now
Download the “dema-indicator.mq4” indicator for Metatrader 4
DEMA + 3D Oscillator Forex MT4 Strategy
Overview
This strategy combines the DEMA Forex Indicator with the 3D Oscillator to create a dynamic trading system.
The DEMA indicator provides a smoothed trend-following signal, while the 3D Oscillator offers overbought and oversold conditions, helping traders time their entries and exits more precisely.
Buy Entry Conditions
- Price crosses above the DEMA indicator.
- 3D Oscillator’s blue line crosses above the red line coming up from below the -80 level, indicating oversold momentum in an uptrend.
- Enter a buy trade at the close of the confirming candle.
- Place a stop loss below the recent swing low or key support.
- Exit when price crosses back below DEMA or the 3D Oscillator’s blue line crosses below the red line from above the +80 level.
Sell Entry Conditions
- Price crosses below the DEMA indicator.
- 3D Oscillator’s blue line crosses below the red line coming down from above the +80 level, indicating overbought momentum in a downtrend.
- Enter a sell trade at the close of the confirming candle.
- Place a stop loss above the recent swing high or key resistance.
- Exit when price crosses back above DEMA turns or the 3D Oscillator’s blue line crosses above the red line from below the -80 level.
Trader Case Studies
Here are some examples of traders from different countries who have applied this strategy successfully on various pairs and timeframes.
Nurul A – Malaysia
Nurul, a part-time trader from Kuala Lumpur, used this strategy on the GBP/USD and EUR/USD pairs over 30 days. By following the rules and managing her risk carefully, she gained +275 pips during this time.
Thabo M – South Africa
Thabo, a full-time trader based in Johannesburg, traded the USD/ZAR and GBP/USD pairs for 40 days using this method. His consistent approach resulted in a total of +395 pips.
Jessica W – USA
Jessica, a day trader from Chicago, applied this strategy on USD/JPY, EUR/GBP, and AUD/USD pairs for two weeks. She recorded a solid profit of +185 pips in that period.
Disclaimer: These case studies are for educational purposes only. Trading results will vary depending on market conditions, risk management, and individual discipline.
Advantages
- Combines trend and momentum indicators to improve accuracy.
- Suitable for various timeframes and currency pairs.
- Helps filter false signals by requiring dual confirmation.
Drawbacks
- Fewer signals during ranging or low volatility markets.
- Confirmation requirements may delay trade entries.
Strategy Conclusion and Tips
This strategy effectively uses the DEMA indicator to identify the trend and the 3D Oscillator to pinpoint momentum extremes, giving traders a better chance to enter high-probability trades.
Practice on a demo account to understand how these tools behave in live markets.
Consistent application and discipline are essential for long-term success with this approach.
Indicator Specifications
| Specification | Details |
|---|---|
| Platform | MetaTrader 4 (MT4) |
| Type | Trend Indicator |
| Timeframes | All MT4 Timeframes |
| Currency Pairs | Major, Minor, and Exotic Pairs |
| Inputs | Variable (inputs tab), color settings & style |
| Signals | Buy/Sell Confirmation |
| Alerts | None |
Frequently Asked Questions (FAQ)
1. How do I know when to enter a trade?
Look for the price to cross above the DEMA line for a buy signal or below it for a sell signal. Confirm the trend with higher timeframes or additional indicators to reduce false entries.
2. What’s the best way to set stop losses?
Place stop losses just beyond recent swing highs for sell trades or swing lows for buy trades. Adjust according to volatility and pip targets to manage risk efficiently.
3. Is this indicator suitable for scalping and swing trading?
Yes, the DEMA Indicator is versatile. Scalpers may use lower timeframes (M1–M15), while swing traders can rely on higher timeframes (H1–D1) for longer-term trends.
Final Words
The DEMA Forex Indicator for MT4 is a valuable tool for traders seeking to identify potential market turning points and make informed trading decisions.
By combining this indicator with other technical analysis tools and practicing sound risk management, traders can enhance their trading strategies and improve their chances of success.


