The DeMarker Histogram Signal indicator for Metatrader 5 is a candle-based technical indicator that delivers buy & sell trading signals.
It draws the buy/sell candlesticks in a separate chart window.
The indicator does not repaint the candles and it suits both beginners and seasoned currency traders.
How to interpret this indicator?
- A DeMarker candle above zero is a bullish signal.
- A DeMarker candle below zero is a bearish signal.
The following indicator inputs and parameters can be modified: period (14), style, color.
The DeMarker Histogram Signal indicator works for any trading instrument (Forex, Stocks, Indices, etc.) that can be loaded in the Metatrader 5 platform.
Make yourself familiar with this technical indicator and test it first on a demo account for an extended period.
It supports all time frames and Forex pairs.
Download Indicator 🆓
DeMarker_Histogram_Vol.mq5 Indicator (MT5)
Chart Example
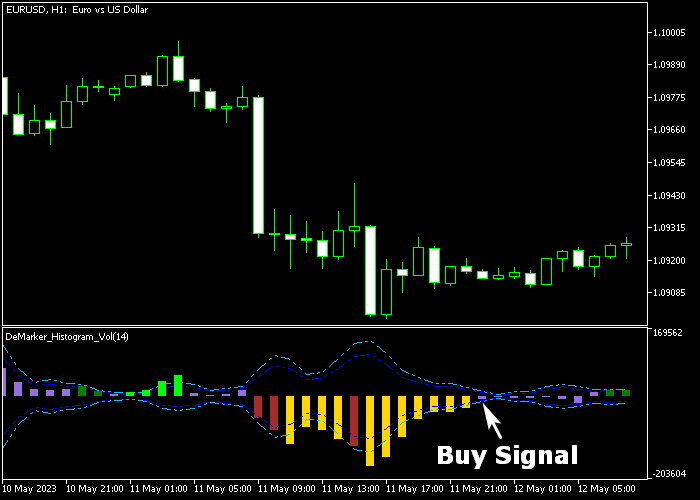
The following chart shows what the DeMarker Histogram Forex Signal indicator looks like when applied to the MT5 chart.

How To Buy And Sell Forex Pairs With The DeMarker Histogram Signal Indicator?
Find a simple trading example below:
Buy Signal
- A buy signal occurs as soon as the first purple colored DeMarker candle gets printed on the chart.
- Open a buy trade and place your stop loss slightly below technical support.
- Exit the buy trade for a fixed take profit of your preference or wait for a sell signal.
Sell Signal
- A sell signal occurs as soon as the first dark red colored DeMarker candle gets printed on the chart.
- Open a sell trade and place your stop loss slightly above technical resistance.
- Exit the sell trade for a fixed take profit of your preference or wait for a buy signal.
Download Now 🆓
DeMarker_Histogram_Vol.mq5 Indicator (MT5)
Frequently Asked Questions
How Do I Install This Custom Indicator On Metatrader 5?
- Open the MT5 trading platform
- Click on the File menu button located at the top left part of the platform
- Click on Open Data Folder > MQL5 folder > Indicators
- Copy the DeMarker_Histogram_Vol.mq5 indicator file in the Indicators folder
- Close and restart the trading platform
- You will find the indicator here (Navigator window > Indicators)
- Drag the indicator to the chart to get started with it!
How Do I Edit This Indicator?
- Click in the open chart with your right mouse button
- In the dropdown menu, click on Indicator List
- Select the indicator and click on properties
- Now you can edit the inputs, colors, levels, scale and visualization
- Finally click the OK button to save the new configuration


