
The Detrended Price Oscillator (DPO) Bar indicator for Metatrader 5 delivers no-repaint trading signals in the form of simple to use colored candles.
Scalpers and intraday traders will get the best results during the London and New York trading hours when using the DPO indicator.
The DPO indicator should be used as follows:
- DPO candles above 0 are bullish. It generates a buy signal.
- DPO candles below 0 are bearish. It generates a sell signal.
Please make yourself familiar with this technical indicator and test it first on a demo account for an extended period.
The DPO indicator works across all possible time frames and trading instruments supported by the MT5 trading platform.
Configurable parameters and input settings: period, method (simple), style, colors.
Download Indicator 🆓
Chart Example
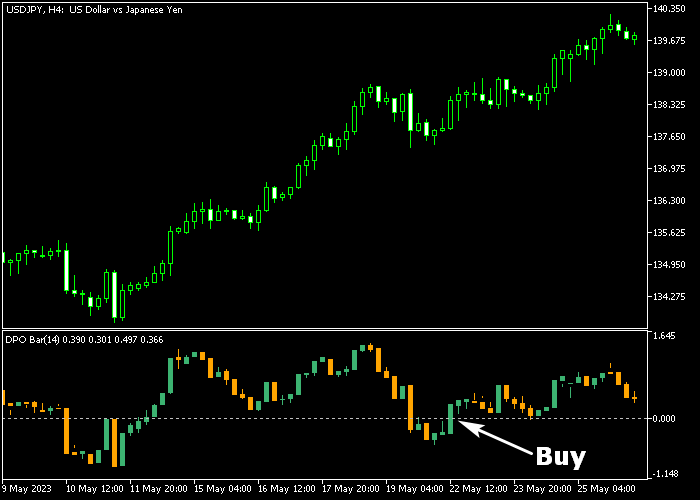
The following chart shows what the Detrended Price Oscillator Bar indicator looks like when applied to the MT5 chart.
How To Buy And Sell Forex Pairs With The Detrended Price Oscillator Bar Indicator?
Find a simple trading example below:
Buy Signal
- A buy signal is given when the green colored DPO candle crosses back above 0.
- Execute a buy trade and add a stop loss below the most recent swing low level.
- Exit the buy trade for a fixed take profit or wait for a sell signal (orange candle below 0).
Sell Signal
- A sell signal is given when the orange colored DPO candle crosses back below 0.
- Execute a sell trade and add a stop loss above the most recent swing high level.
- Exit the sell trade for a fixed take profit or wait for a buy signal (green candle above 0).
Download Now 🆓
Frequently Asked Questions
How Do I Install This Custom Indicator On Metatrader 5?
- Open the MT5 trading platform
- Click on the File menu button located at the top left part of the platform
- Click on Open Data Folder > MQL5 folder > Indicators
- Copy the DPO_Bar.mq5 indicator file in the Indicators folder
- Close and restart the trading platform
- You will find the indicator here (Navigator window > Indicators)
- Drag the indicator to the chart to get started with it!
How Do I Edit This Indicator?
- Click in the open chart with your right mouse button
- In the dropdown menu, click on Indicator List
- Select the indicator and click on properties
- Now you can edit the inputs, colors, levels, scale and visualization
- Finally click the OK button to save the new configuration


